The Asia Opening Range
on Gold
One trade a day, Monday to Thursday, decided in the fifteen minutes after midnight UTC. This is the complete rule set, why each rule is there, and every trade it produced in 2026.
01The rules
Everything is mechanical. No discretion, no judgement calls, and nothing that needs you awake at a screen.
- Mark the rangeTake the highest high and lowest low of the fifteen M1 candles from 00:00 to 00:14 UTC. That box is the range.
- Split the box in half and see where the 00:14 candle closedClosed in the top half → you may only take an upward break. Closed in the bottom half → only a downward break. Breaks the other way are skipped — section 02.
- Watch for a break until 00:29The first M1 candle to close outside the box triggers the trade — above the high goes long, below the low goes short. Wicks poking through don't count. Nothing by 00:29 means no trade.
- Enter at marketOn the next candle, in the direction of the break.
- Stop at the range midpointHalfway between the high and the low. That distance is your 1R.
- Target at 2RTwice the distance from entry to stop, measured from the actual fill.
- At +0.5R, move the stop to −0.5ROnce the trade is that far toward target, pull the stop so the worst case is a part loss instead of a full one. Once only — it never moves again.
- Flat after 90 minutesIf neither level is hit, close at market. 95% of trades finish on their own before this.
- Monday to Thursday, one trade a dayFridays off. One position, then done regardless of the outcome.
- Risk 2.5% of the starting balanceFixed, not compounding. Position size = 2.5% ÷ the distance from entry to stop.
| Input | Value | Meaning |
|---|---|---|
InpTimeZone | TZ_UTC | session clock |
InpStartHour / Minute | 0 / 0 | 00:00 UTC |
InpRangeMinutes | 15 | range length, so the box closes 00:14 |
InpSignalTF | M1 | confirmation candle |
InpEntryMode | MARKET_ON_CLOSE | market, the moment the signal candle closes |
InpNoEntryAfterMin | 15 | stop looking at 00:29 |
InpMinClosePos | 0.50 | trade only the half it closed in |
InpTradeLongs / Shorts | true / true | either direction |
InpSLPercentOfRange | 50 | stop at the midpoint |
InpRR | 2 | target |
InpStopMoveAtR / ToR | 0.5 / −0.5 | the stop move |
InpMaxHoldMinutes | 90 | time cap |
InpTradeFri | false | Fridays off |
InpRiskPercent | 2.5 | risk per trade |
02The half-of-the-range rule
One filter, and it is the only one the edge needs. Draw a line across the middle of the range box and ask which half the 00:14 candle closed in. That half is the only direction you are allowed to trade today.
Closed in the top half → longs only. If price breaks
down instead, you sit out.
Closed in the bottom half → shorts only. If price breaks
up instead, you sit out.
Reading it live, in three seconds
- At 00:15, look at the box and find its middle.
- Did the last candle close above the middle? Only a break of the high counts today.
- Below the middle? Only a break of the low counts.
- Price breaks the wrong side → no trade, close the platform.
The candle's colour doesn't matter. A red candle sitting near the top of the box still counts as the top half — it drifted down a little but price is still up there. You are reading where it is, not which way it moved.
| Which half broke | Trades | Wins | Win rate | Profit factor | EV per trade | Total R | Total % | Verdict |
|---|---|---|---|---|---|---|---|---|
| Broke the half it closed in | 76 | 39 | 51.3% | 2.33 | +0.560 | +42.6 R | +106.5% | TRADE |
| Broke the opposite half | 18 | 4 | 22.2% | 0.78 | -0.126 | -2.3 R | -5.8% | SKIP |
| Every break, no filter | 94 | 43 | 45.7% | 1.95 | +0.429 | +40.3 R | +100.8% |
Trading every break returns +40.3 R from 94 trades at a 45.7% win rate. Trading only the correct half returns +43.6 R from 75 — virtually the same money from 18 fewer trades, at a 52.0 win rate. The 18 skipped trades contributed -2.3 R between them: all of the drawdown, none of the profit. Fewer trades at a higher win rate is exactly what a pass-rate account wants.
03The stop move
Once per trade, and only in one direction.
- 12 of the 36 losses were halved.
- Average loss -0.86 R, not −1.00 R.
- Saved +4.9 R — +12.2% of the account.
| Exit | Trades | Share | EV each | Total R | Total % |
|---|---|---|---|---|---|
| Stopped out | 36 | 48.0% | -0.86 R | -31.1 R | -77.8% |
| Target hit (+2R) | 35 | 46.7% | +2.04 R | +71.3 R | +178.2% |
| 90-minute cap | 4 | 5.3% | +0.84 R | +3.3 R | +8.2% |
Nearly even on count — 35 targets, 36 stops. The edge is size: a win pays 2R, a loss costs 0.86R.
04Why each rule exists
Every number was measured, not chosen. Here is the reasoning in plain terms.
| Rule | Why this and not something else |
|---|---|
| 00:00 UTC | A quiet handover between New York closing and Asia opening — not an auction. Ranges built inside an opening auction get violated in both directions and carry no information. |
| 15-minute range | Shorter is better. A 30- or 60-minute range gives a wider box, a wider stop, a smaller position and a worse result. The information is in the first fifteen minutes. |
| M1 confirmation | The fastest candle catches the earliest break, and the earliest break is the best one — 39% of all breaks happen within five minutes of the range closing. |
| Entries stop at 00:29 | A range that takes more than fifteen minutes to give way is drifting, not breaking. Including later breaks cuts expectancy by more than half. |
| Stop at the midpoint | Tighter stops sit inside normal noise and get taken out before the move resolves. Wider stops shrink the position so much that the 2R target becomes unreachable inside the hour. The midpoint is the balance point. |
| 2R target | Roughly five times the expectancy of a 1R target. Pushing to 3R lowers the win rate faster than it raises the payoff. |
| Stop to −0.5R, never to breakeven | A breakeven stop sits exactly where price retests after a breakout — it stops you for nothing on trades that would have worked. Half a risk unit back is far enough away to survive the retest. |
| Trigger at +0.5R | Moving earlier tightens the stop while the trade is still inside noise. Moving later leaves more on the table when it reverses. |
| 90-minute cap | 95% of trades finish on their own before it. The cap only touches the tail, and it keeps you out of the market rather than holding through the London open. At 60 minutes it was cutting three trades off within a hair of their target. |
| Monday to Thursday | Friday's Asia session runs into weekend position-squaring — flow driven by people flattening rather than committing. It was the only losing day of the week, at a 20.8% win rate. |
| One trade a day | Keeps a bad day to a single loss and the daily exposure well inside any prop-firm daily limit. |
05Results
2026, MetaTrader 5, real tick data, spread and commission included. Risk is a fixed 2.5% of the starting balance on every trade — no compounding, so each R is worth a constant two percentage points.
| Quarter | Trading days | Trades | W / L | Win rate | Profit factor | EV per trade | Total R | Total % |
|---|---|---|---|---|---|---|---|---|
| Q1 | 50 | 26 | 16 / 10 | 61.5% | 3.76 | +0.828 | +21.5 R | +53.8% |
| Q2 | 52 | 28 | 13 / 15 | 46.4% | 2.02 | +0.454 | +12.7 R | +31.8% |
| Q3 | 45 | 21 | 10 / 11 | 47.6% | 1.87 | +0.445 | +9.4 R | +23.5% |
| Month | Trading days | Trades | W / L | Sequence | Win rate | Profit factor | EV per trade | Total R | Total % |
|---|---|---|---|---|---|---|---|---|---|
| Jan | 16 | 6 | 5 / 1 | W-W-W-W-L-W | 83.3% | 9.13 | +1.394 | +8.4 R | +21.0% |
| Feb | 16 | 9 | 4 / 5 | L-L-W-L-W-W-L-L-W | 44.4% | 1.77 | +0.397 | +3.6 R | +9.0% |
| Mar | 18 | 11 | 7 / 4 | L-L-L-W-W-L-W-W-W-W-W | 63.6% | 5.47 | +0.874 | +9.6 R | +24.0% |
| Apr | 18 | 10 | 5 / 5 | W-L-L-W-W-L-L-W-L-W | 50.0% | 2.22 | +0.565 | +5.6 R | +14.0% |
| May | 16 | 8 | 4 / 4 | L-L-L-W-W-W-L-W | 50.0% | 2.17 | +0.455 | +3.6 R | +9.0% |
| Jun | 18 | 10 | 4 / 6 | L-L-L-W-L-L-W-W-W-L | 40.0% | 1.73 | +0.343 | +3.4 R | +8.5% |
| Jul | 18 | 7 | 5 / 2 | L-L-W-W-W-W-W | 71.4% | 4.82 | +1.149 | +8.0 R | +20.0% |
| Aug | 17 | 10 | 5 / 5 | W-L-W-W-W-L-L-W-L-L | 50.0% | 2.16 | +0.538 | +5.4 R | +13.5% |
| Sep | 10 | 4 | 0 / 4 | L-L-L-L | 0.0% | 0.00 | -1.018 | -4.1 R | -10.2% |
Q1 +21.5 R, Q2 +12.7 R, Q3 +9.4 R.
06Week by week
Actual trading days per week — Monday to Thursday, so four in a full week and fewer around holidays. Greyed rows are weeks where no session met the entry conditions.
| Week | Trading days | Trades | W / L | Sequence | Win rate | Profit factor | EV per trade | Total R | Total % |
|---|---|---|---|---|---|---|---|---|---|
| 05 Jan – 08 Jan | 4 | 1 | 1 / 0 | W | 100% | – | +2.037 | +2.0 R | +5.0% |
| 12 Jan – 15 Jan | 4 | 3 | 3 / 0 | W-W-W | 100% | – | +1.787 | +5.4 R | +13.5% |
| 19 Jan – 22 Jan | 4 | 2 | 1 / 1 | L-W | 50% | 1.94 | +0.482 | +1.0 R | +2.5% |
| 26 Jan – 29 Jan | 4 | 0 | – | – | – | – | – | – | – |
| 02 Feb – 05 Feb | 4 | 3 | 1 / 2 | L-L-W | 33% | 1.28 | +0.147 | +0.4 R | +1.0% |
| 09 Feb – 12 Feb | 4 | 1 | 0 / 1 | L | 0% | 0.00 | -1.034 | -1.0 R | -2.5% |
| 16 Feb – 19 Feb | 4 | 2 | 2 / 0 | W-W | 100% | – | +2.101 | +4.2 R | +10.5% |
| 23 Feb – 26 Feb | 4 | 3 | 1 / 2 | L-L-W | 33% | 0.98 | -0.013 | -0.0 R | -0.0% |
| 02 Mar – 05 Mar | 4 | 3 | 0 / 3 | L-L-L | 0% | 0.00 | -0.544 | -1.6 R | -4.0% |
| 09 Mar – 12 Mar | 4 | 2 | 2 / 0 | W-W | 100% | – | +1.605 | +3.2 R | +8.0% |
| 16 Mar – 19 Mar | 4 | 1 | 0 / 1 | L | 0% | 0.00 | -0.520 | -0.5 R | -1.2% |
| 23 Mar – 26 Mar | 4 | 4 | 4 / 0 | W-W-W-W | 100% | – | +1.534 | +6.1 R | +15.2% |
| 30 Mar – 02 Apr | 4 | 3 | 2 / 1 | W-W-L | 67% | 4.39 | +1.151 | +3.5 R | +8.8% |
| 06 Apr – 09 Apr | 4 | 2 | 1 / 1 | L-W | 50% | 1.90 | +0.474 | +0.9 R | +2.2% |
| 13 Apr – 16 Apr | 4 | 3 | 1 / 2 | W-L-L | 33% | 1.29 | +0.150 | +0.4 R | +1.0% |
| 20 Apr – 23 Apr | 4 | 2 | 1 / 1 | W-L | 50% | 2.19 | +0.595 | +1.2 R | +3.0% |
| 27 Apr – 30 Apr | 4 | 1 | 1 / 0 | W | 100% | – | +2.026 | +2.0 R | +5.0% |
| 04 May – 07 May | 4 | 0 | – | – | – | – | – | – | – |
| 11 May – 14 May | 4 | 3 | 0 / 3 | L-L-L | 0% | 0.00 | -0.680 | -2.0 R | -5.0% |
| 18 May – 21 May | 4 | 4 | 3 / 1 | W-W-W-L | 75% | 5.64 | +1.246 | +5.0 R | +12.5% |
| 25 May – 28 May | 4 | 1 | 1 / 0 | W | 100% | – | +0.698 | +0.7 R | +1.8% |
| 01 Jun – 04 Jun | 4 | 2 | 0 / 2 | L-L | 0% | 0.00 | -0.514 | -1.0 R | -2.5% |
| 08 Jun – 11 Jun | 4 | 2 | 1 / 1 | L-W | 50% | 1.87 | +0.466 | +0.9 R | +2.2% |
| 15 Jun – 18 Jun | 4 | 3 | 1 / 2 | L-L-W | 33% | 1.27 | +0.141 | +0.4 R | +1.0% |
| 22 Jun – 25 Jun | 4 | 2 | 2 / 0 | W-W | 100% | – | +2.066 | +4.1 R | +10.2% |
| 29 Jun – 02 Jul | 4 | 2 | 0 / 2 | L-L | 0% | 0.00 | -1.018 | -2.0 R | -5.0% |
| 06 Jul – 09 Jul | 4 | 1 | 0 / 1 | L | 0% | 0.00 | -1.094 | -1.1 R | -2.8% |
| 13 Jul – 16 Jul | 4 | 0 | – | – | – | – | – | – | – |
| 20 Jul – 23 Jul | 4 | 3 | 3 / 0 | W-W-W | 100% | – | +2.040 | +6.1 R | +15.2% |
| 27 Jul – 30 Jul | 4 | 2 | 2 / 0 | W-W | 100% | – | +2.014 | +4.0 R | +10.0% |
| 03 Aug – 06 Aug | 4 | 1 | 1 / 0 | W | 100% | – | +1.995 | +2.0 R | +5.0% |
| 10 Aug – 13 Aug | 4 | 3 | 2 / 1 | L-W-W | 67% | 7.46 | +1.156 | +3.5 R | +8.8% |
| 17 Aug – 20 Aug | 4 | 3 | 1 / 2 | W-L-L | 33% | 0.98 | -0.013 | -0.0 R | -0.0% |
| 24 Aug – 27 Aug | 4 | 2 | 1 / 1 | W-L | 50% | 1.95 | +0.489 | +1.0 R | +2.5% |
| 31 Aug – 03 Sep | 4 | 3 | 0 / 3 | L-L-L | 0% | 0.00 | -1.013 | -3.0 R | -7.5% |
| 07 Sep – 10 Sep | 4 | 2 | 0 / 2 | L-L | 0% | 0.00 | -1.027 | -2.1 R | -5.2% |
| 14 Sep – 17 Sep | 3 | 0 | – | – | – | – | – | – | – |
The pattern worth noticing: you take a trade on roughly half the days available. 75 trades from 147 eligible sessions. Most weeks produce two or three trades, and a handful produce none at all — those are weeks where the half-of-the-range rule or the entry window ruled every session out. Sitting out is part of the edge, not a failure of it.
07Risk and sizing
A funded-account challenge is a race between a profit target and a drawdown limit. That makes streaks matter more than averages.
| Risk per trade | Pass | Trades needed | ~Days | Total return | Worst drawdown | 6 losses cost | Worst single loss |
|---|---|---|---|---|---|---|---|
| 0.5% | 100.0% | 40 | 78 | +22% | 3.1% | 3.1% | -0.55% |
| 0.75% | 100.0% | 26 | 51 | +33% | 4.6% | 4.6% | -0.82% |
| 1% | 100.0% | 19 | 37 | +44% | 6.2% | 6.1% | -1.09% |
| 1.25% | 99.8% | 15 | 29 | +54% | 7.7% | 7.7% | -1.37% |
| 1.5% | 99.5% | 13 | 25 | +65% | 9.2% | 9.2% | -1.64% |
| 1.75% | 99.0% | 11 | 22 | +76% | 10.8% | 10.7% | -1.91% |
| 2% | 98.4% | 9 | 18 | +87% | 12.3% | 12.2% | -2.19% |
| 2.25% | 97.4% | 8 | 16 | +98% | 13.8% | 13.8% | -2.46% |
| 2.5% | 96.8% | 7 | 14 | +109% | 15.4% | 15.3% | -2.74% |
The highlighted row is the risk set at the top; the field there accepts any value and snaps to a simulated level. Pass, trades and days come from walking the real outcomes against the barriers, not from scaling.
| Consecutive losses | Times | Worst it actually cost | At the risk above |
|---|---|---|---|
| 1 in a row | 6× | -1.09 R | 2.7% of the account |
| 2 in a row | 6× | -2.10 R | 5.3% of the account |
| 3 in a row | 4× | -3.13 R | 7.8% of the account |
| 6 in a row | 1× | -6.12 R | 15.3% of the account |
A 6-loss run happened once, and at 2.5% risk it costs 15% — past the 12% limit.
Realised drawdown reached 15.4% because a winner landed before that run started from a peak. The same sequence hitting a fresh account is the failure case, and it is the only one worth planning for — nearly every simulated failure is one long losing run rather than a slow bleed.
Position sizing, worked
- Account $10,000, risk 2.5% → $250 per trade, every trade.
- Range is 1,000 points ($10.00) → stop sits 500 points ($5.00) away.
- Gold moves $1 per point per lot, so $5.00 of stop = $500 per lot.
- Size = $250 ÷ $500 = 0.50 lots.
A wider range means a wider stop and therefore a smaller position — the dollar risk stays at $200 regardless. That is what makes every result comparable in R.
08The range filter
Filter on at 0.14%: 136 of 274 sessions traded, +0.260 R a trade instead of -0.019, 39.7% won instead of 29.9%.
| Group | Range width | Sessions | Win rate | EV per trade | Total R | Total % |
|---|---|---|---|---|---|---|
| Narrowest 25% | 0.031–0.082% | 68 | 14.7% | -0.474 R | -32.2 R | -80.5% |
| Second 25% | 0.082–0.137% | 68 | 25.0% | -0.138 R | -9.4 R | -23.5% |
| Third 25% | 0.137–0.237% | 68 | 33.8% | +0.118 R | +8.0 R | +20.0% |
| Widest 25% | 0.241–2.167% | 70 | 45.7% | +0.405 R | +28.3 R | +70.8% |
09Monte Carlo simulation
Draw a trade at random from the 75 real results, add it, repeat until the account hits +12% or −12%. That is one attempt. Eighty of them are drawn below; the numbers come from 40 000.
10Every trade
All 75 trades of 2026, in order. Each chart shows the range, the entry, the stop, the target, where the stop moved to, and the exit. Click any one to open it full size.
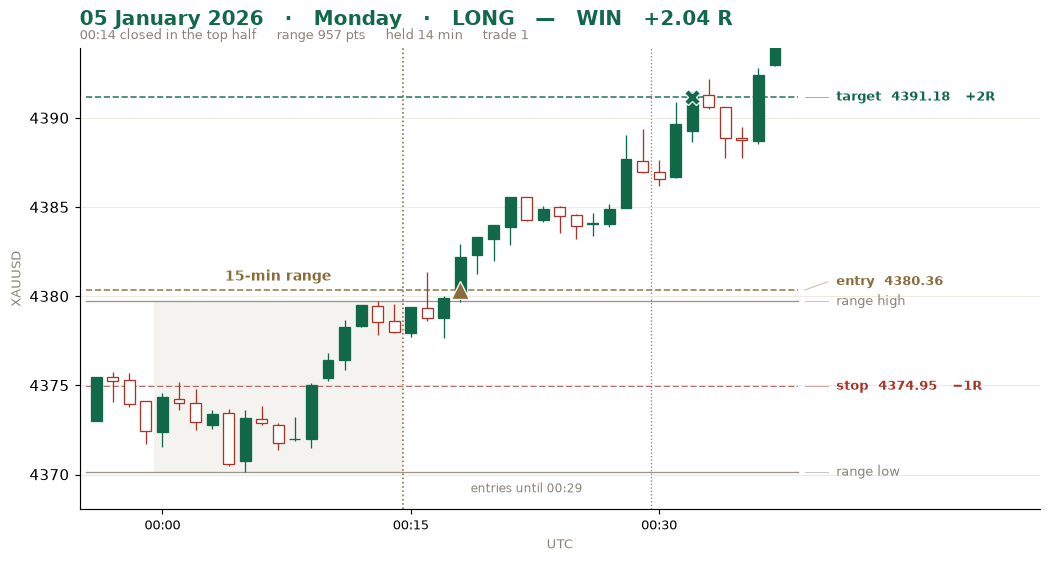 05 Jan Mon · BUY · closed top half · +2.04 R
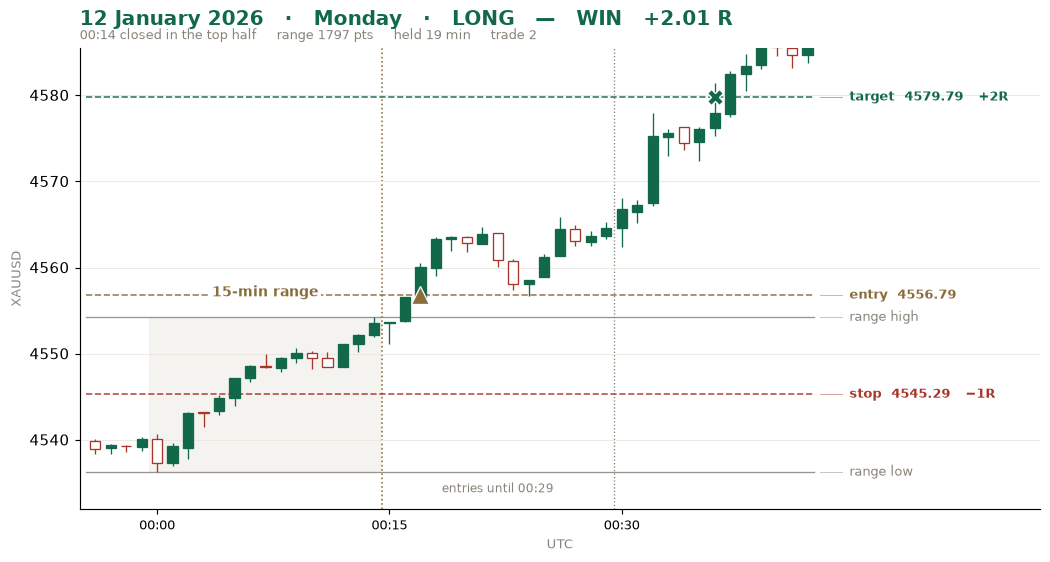 12 Jan Mon · BUY · closed top half · +2.01 R
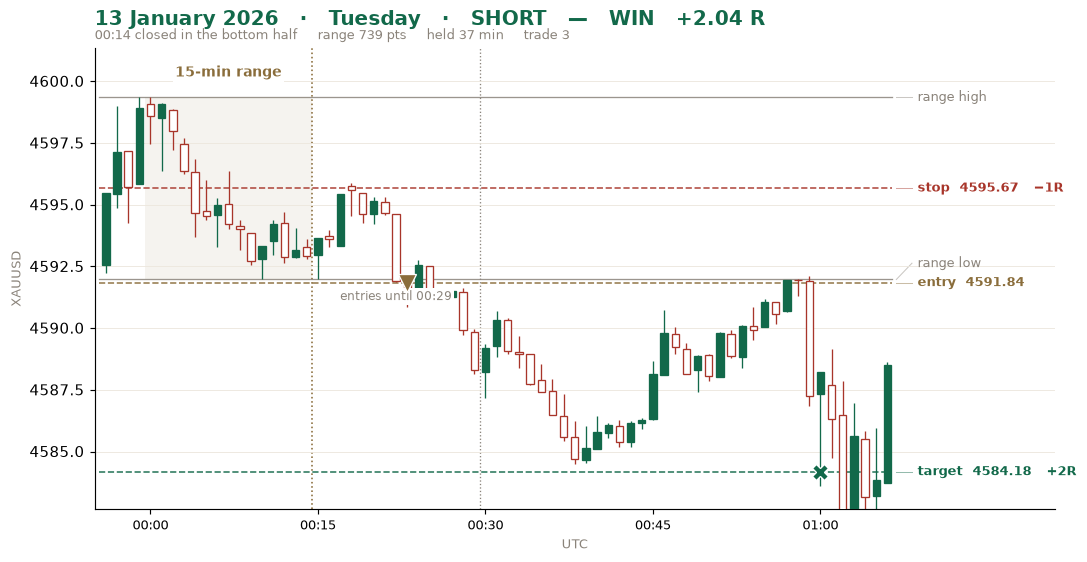 13 Jan Tue · SELL · closed bottom half · +2.04 R
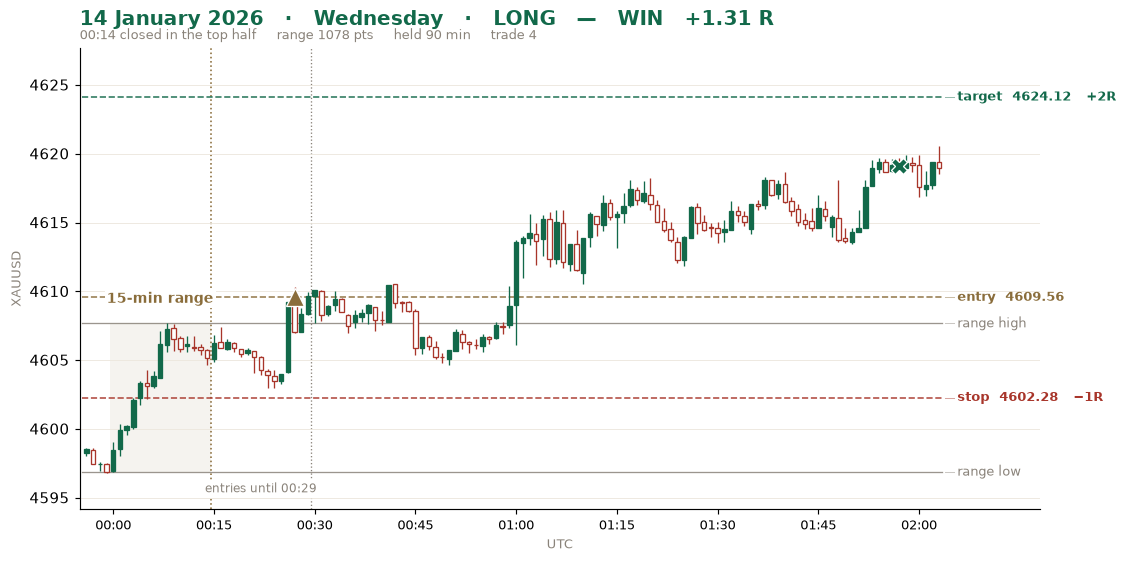 14 Jan Wed · BUY · closed top half · +1.31 R
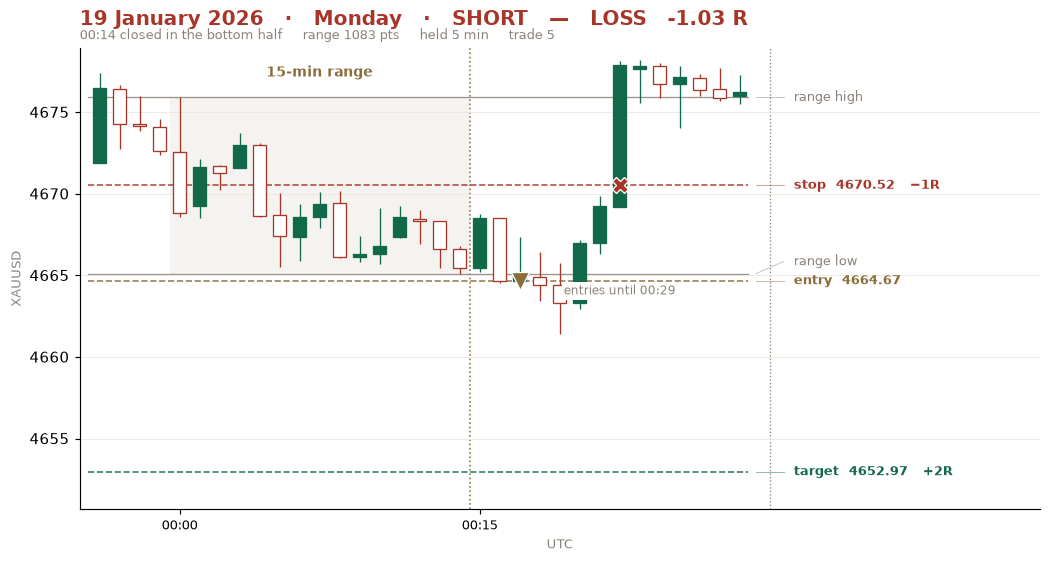 19 Jan Mon · SELL · closed bottom half · -1.03 R
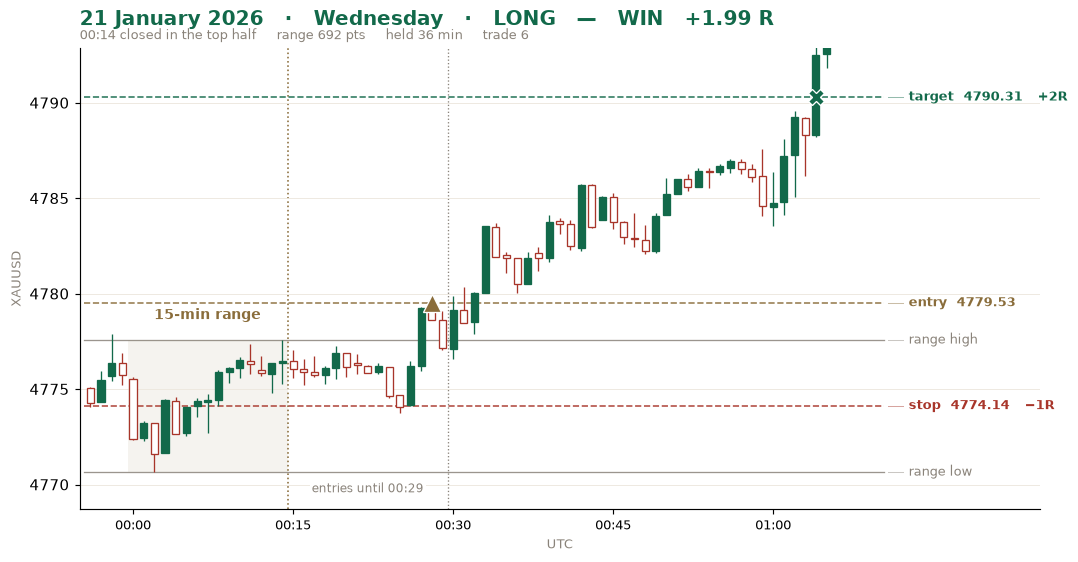 21 Jan Wed · BUY · closed top half · +1.99 R
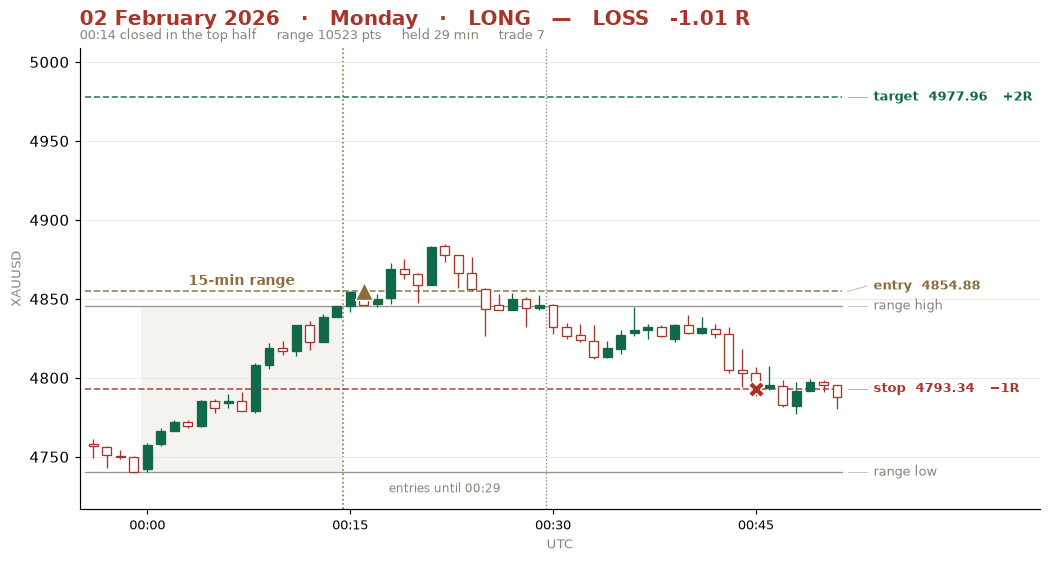 02 Feb Mon · BUY · closed top half · -1.01 R
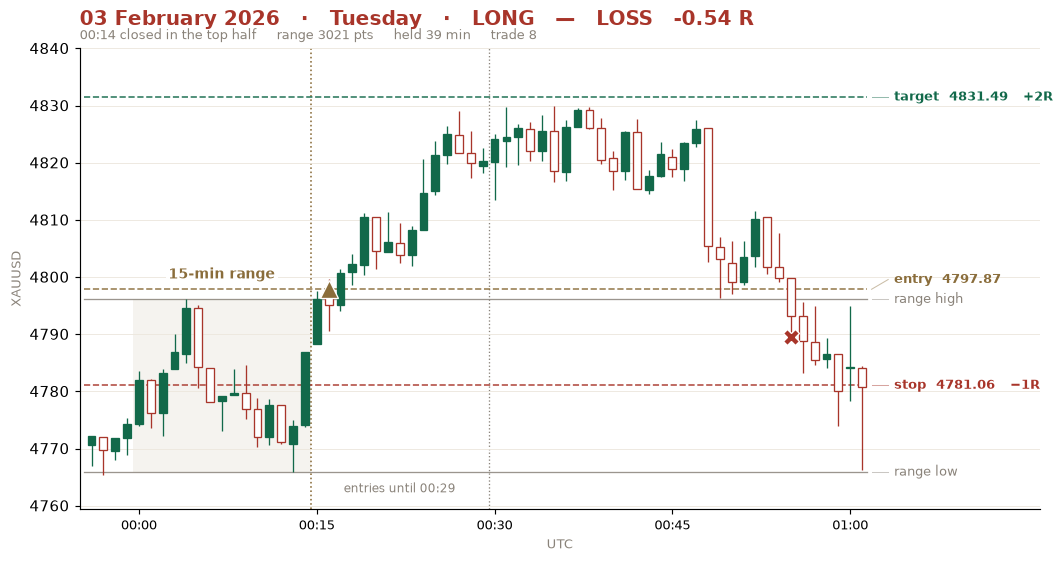 03 Feb Tue · BUY · closed top half · -0.54 R
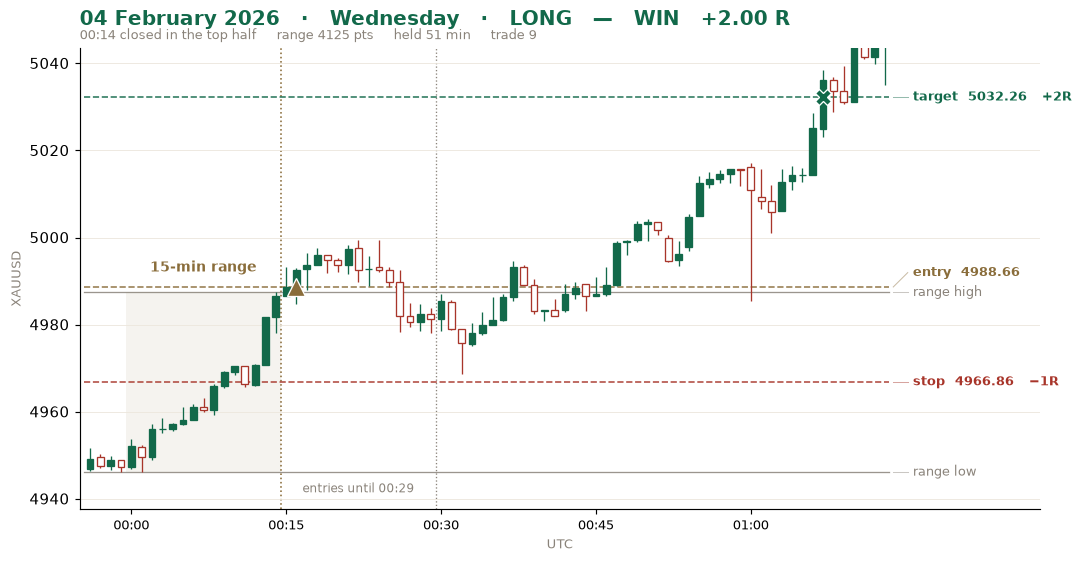 04 Feb Wed · BUY · closed top half · +2.00 R
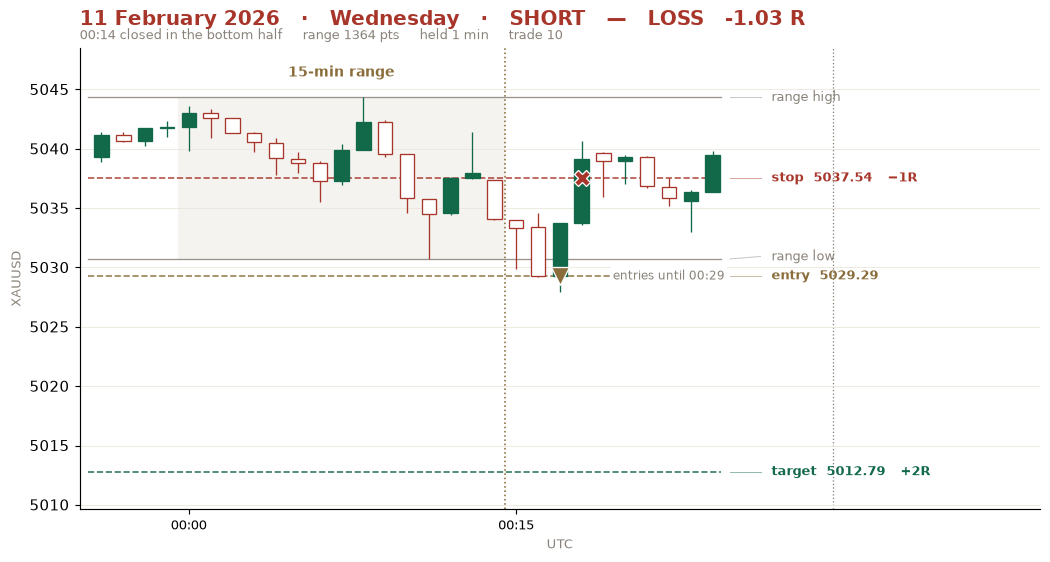 11 Feb Wed · SELL · closed bottom half · -1.03 R
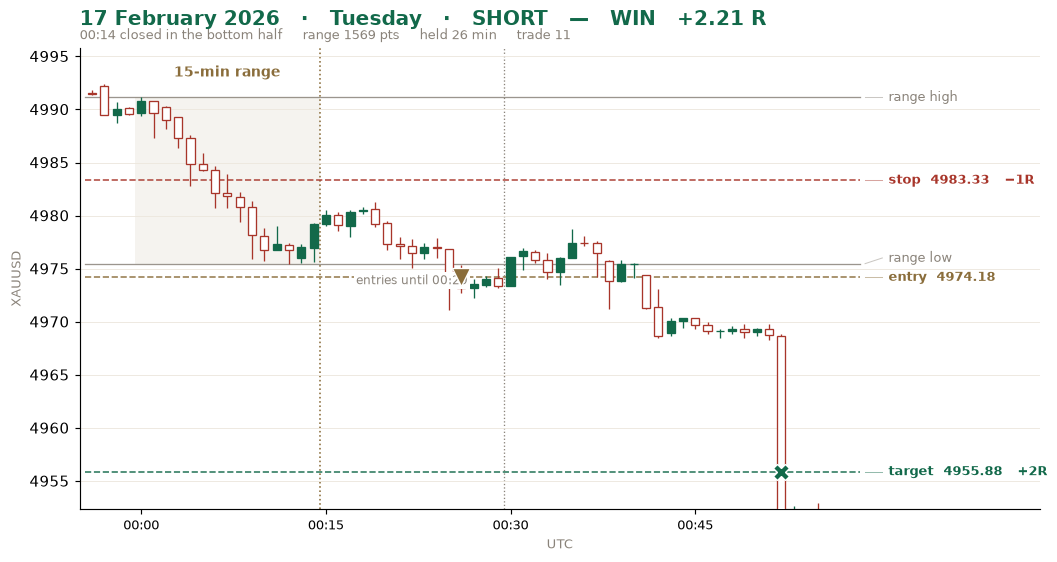 17 Feb Tue · SELL · closed bottom half · +2.21 R
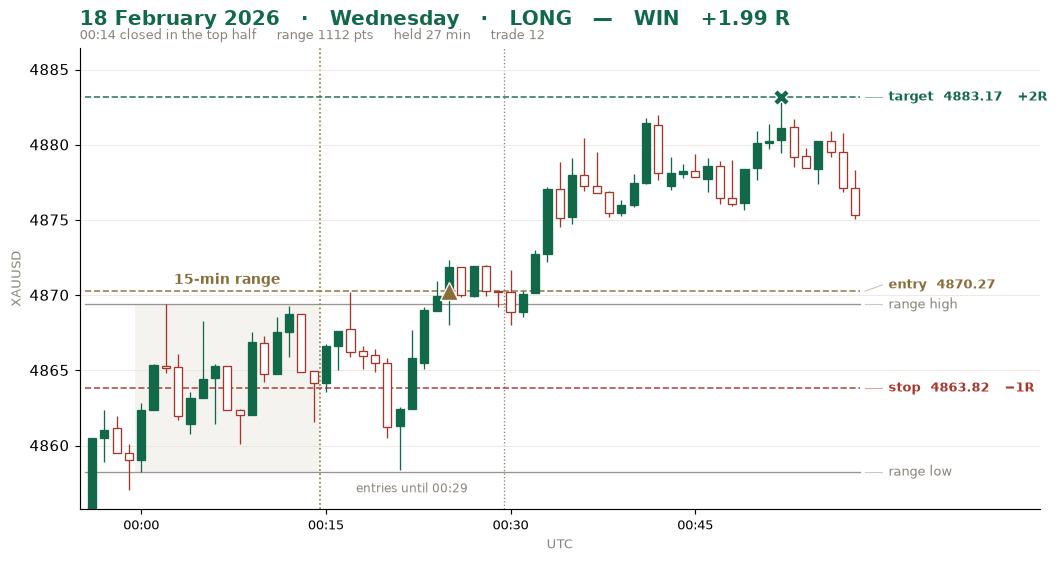 18 Feb Wed · BUY · closed top half · +1.99 R
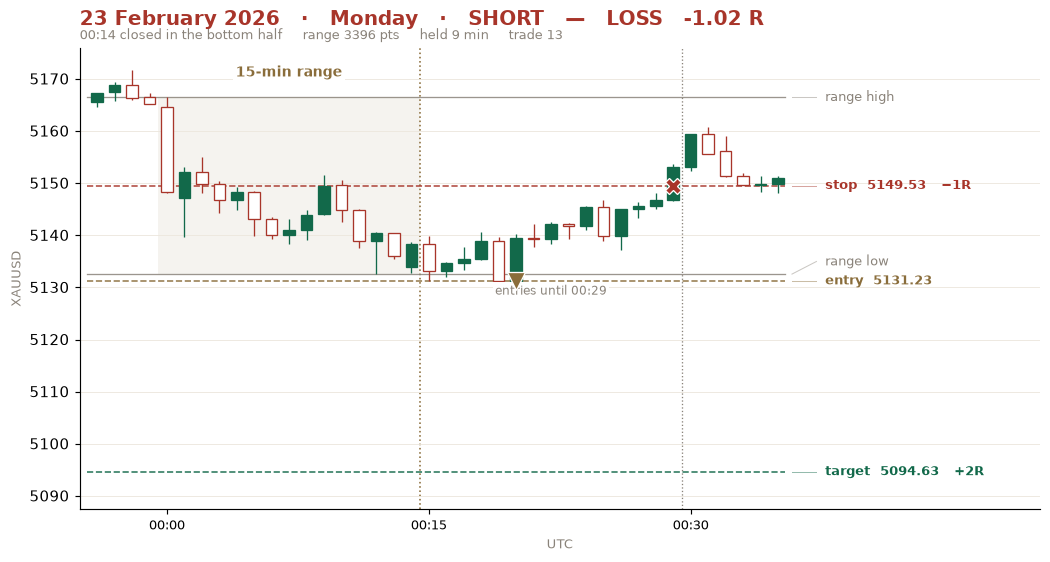 23 Feb Mon · SELL · closed bottom half · -1.02 R
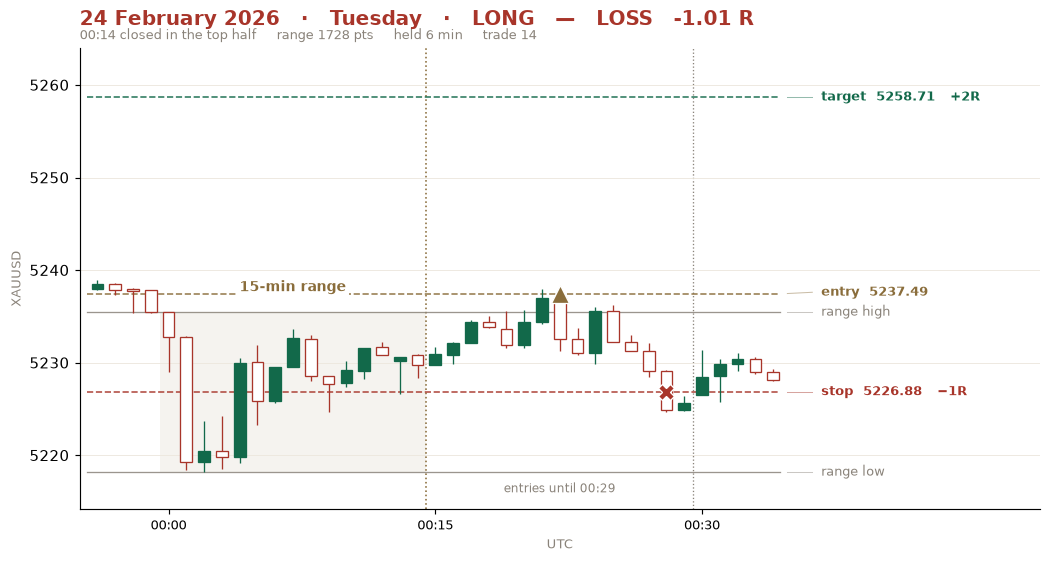 24 Feb Tue · BUY · closed top half · -1.01 R
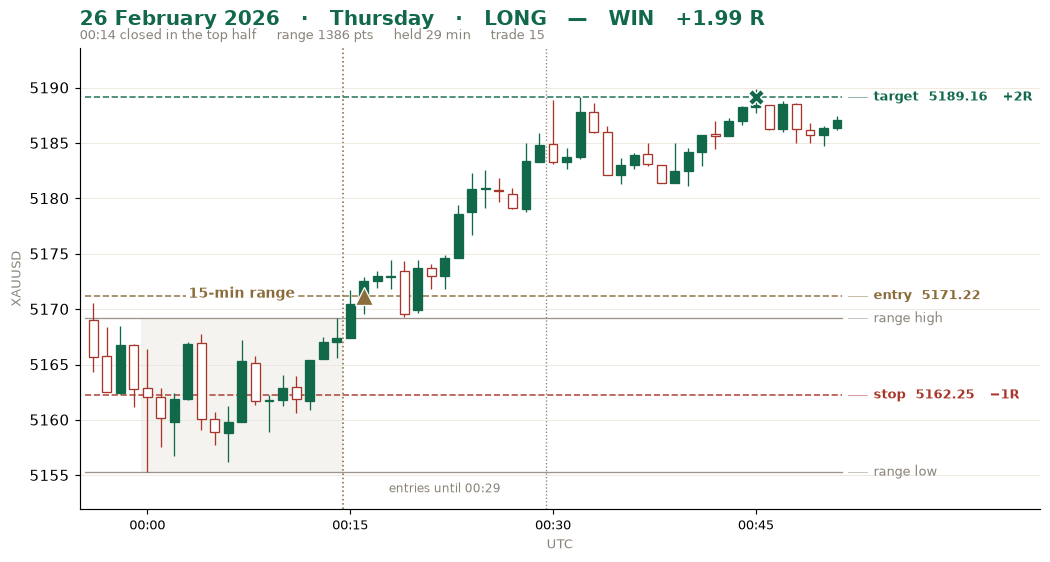 26 Feb Thu · BUY · closed top half · +1.99 R
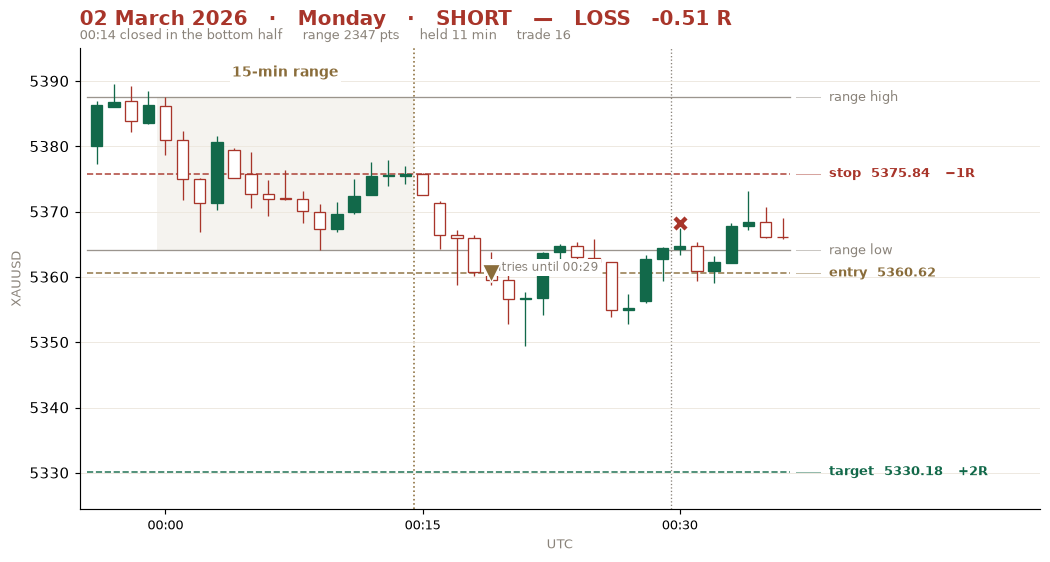 02 Mar Mon · SELL · closed bottom half · -0.51 R
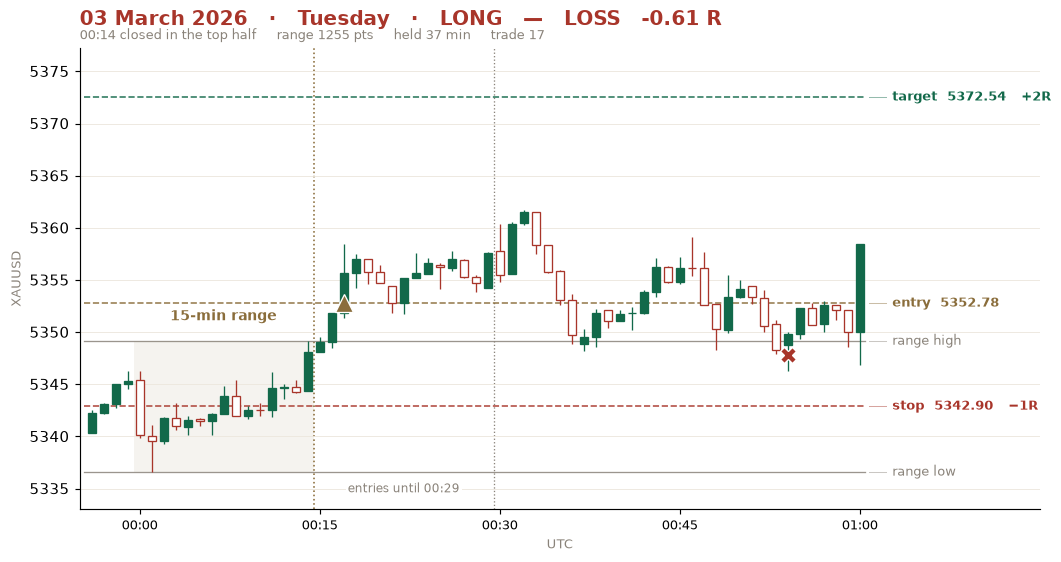 03 Mar Tue · BUY · closed top half · -0.61 R
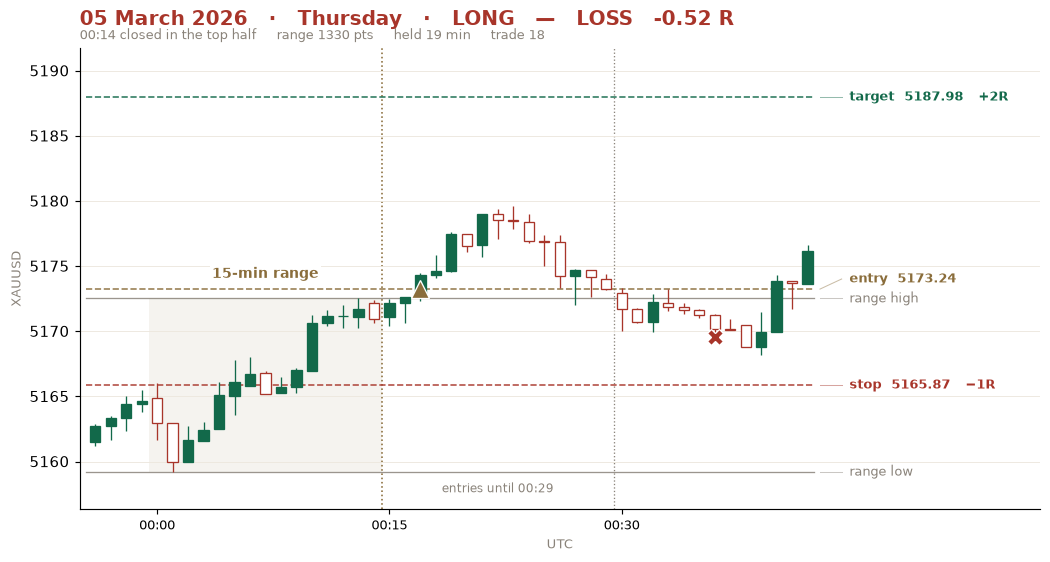 05 Mar Thu · BUY · closed top half · -0.52 R
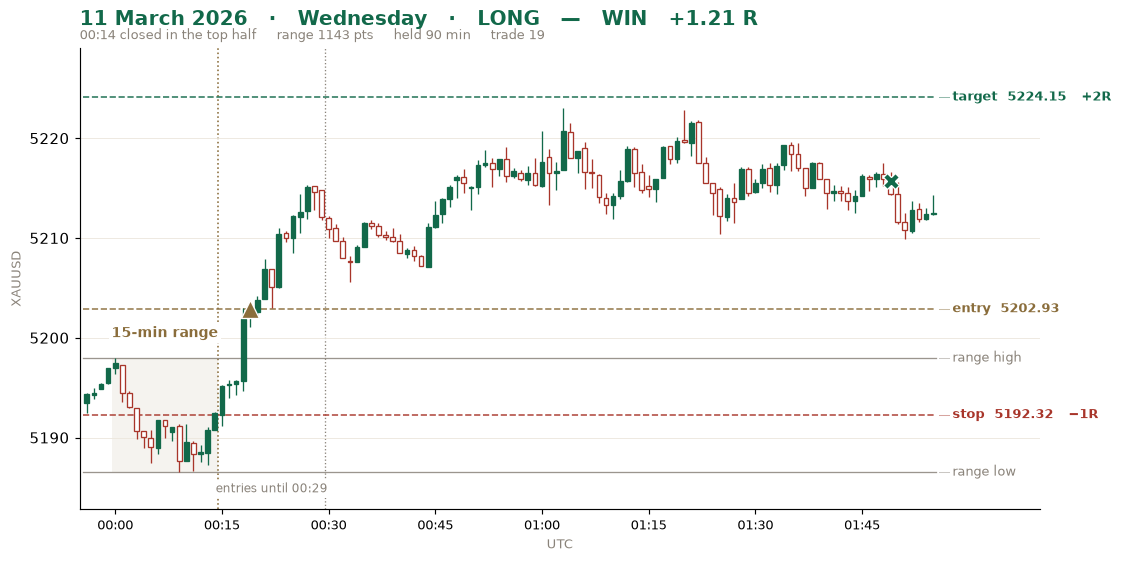 11 Mar Wed · BUY · closed top half · +1.21 R
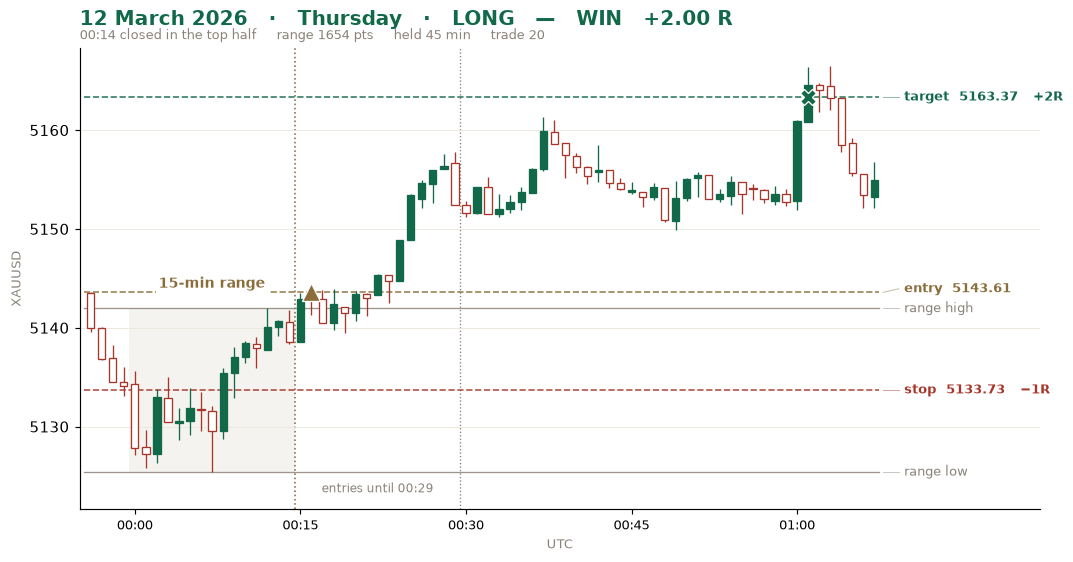 12 Mar Thu · BUY · closed top half · +2.00 R
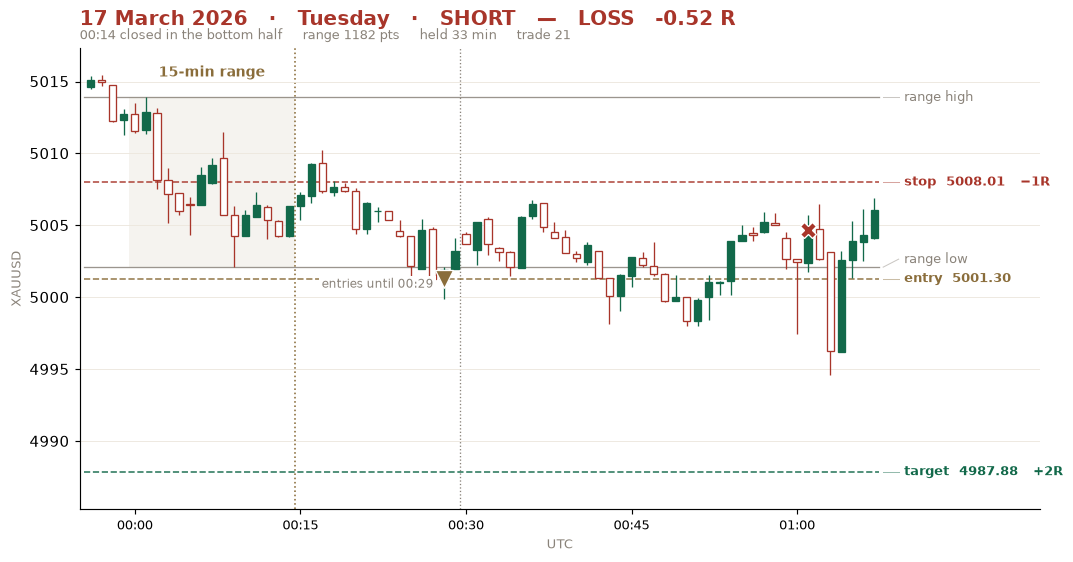 17 Mar Tue · SELL · closed bottom half · -0.52 R
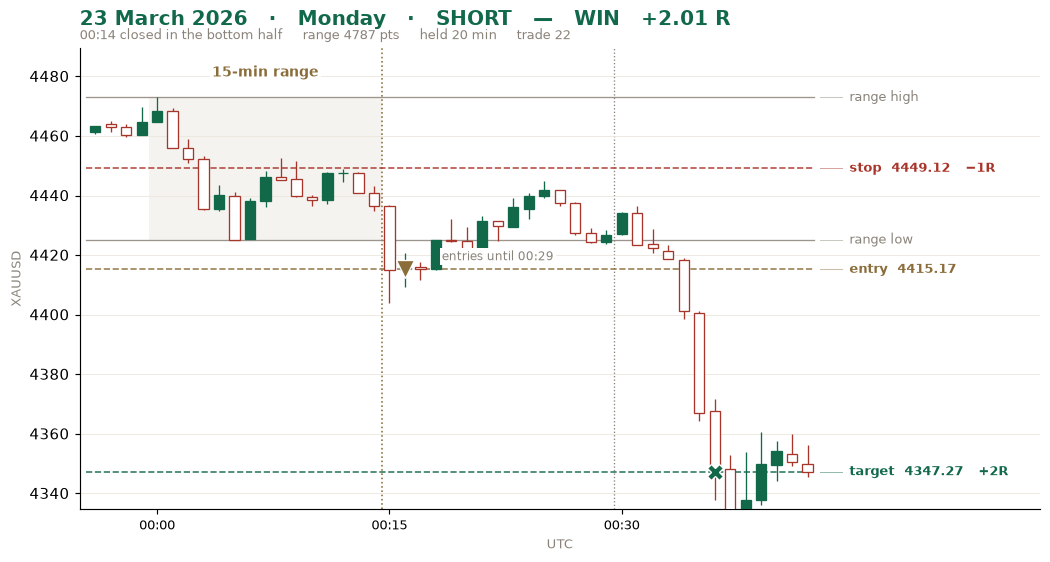 23 Mar Mon · SELL · closed bottom half · +2.01 R
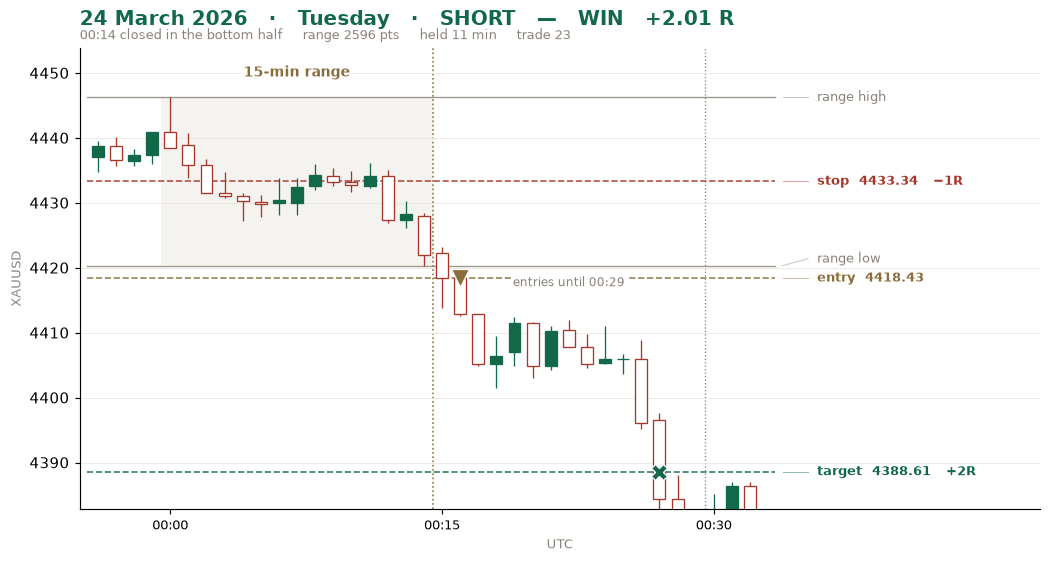 24 Mar Tue · SELL · closed bottom half · +2.01 R
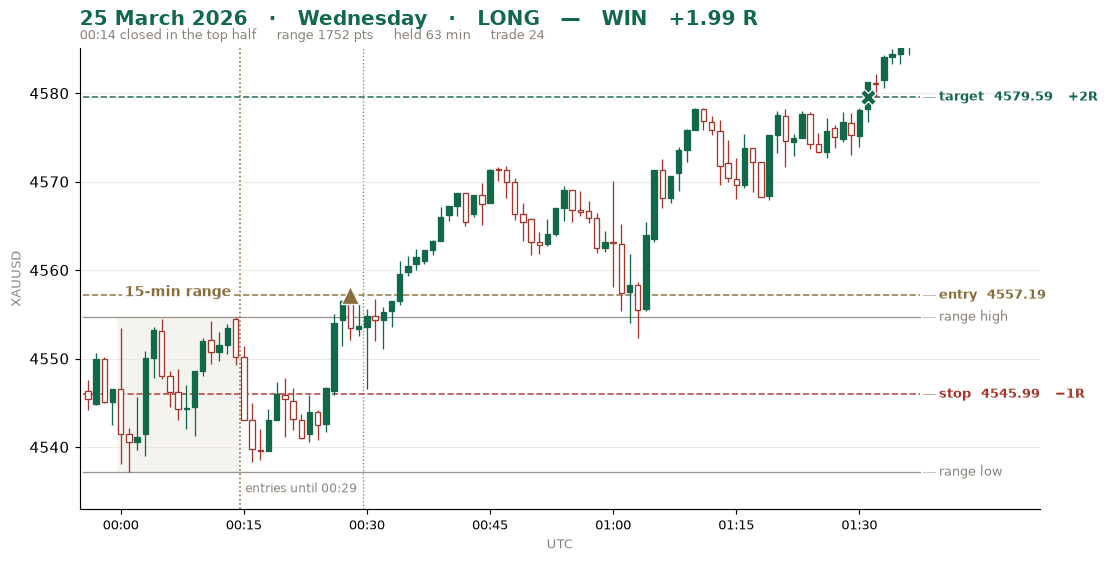 25 Mar Wed · BUY · closed top half · +1.99 R
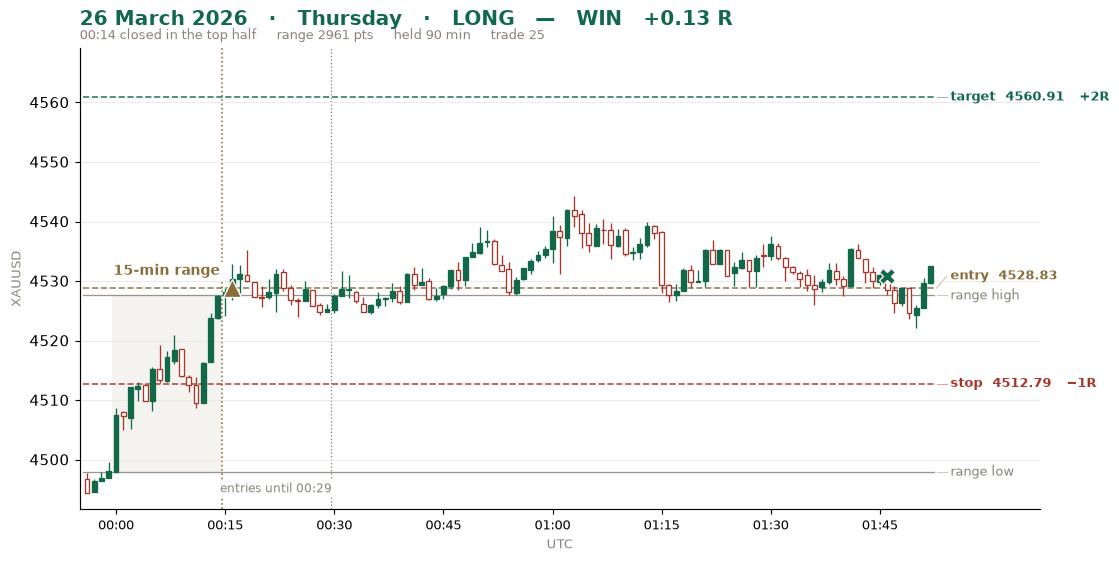 26 Mar Thu · BUY · closed top half · +0.13 R
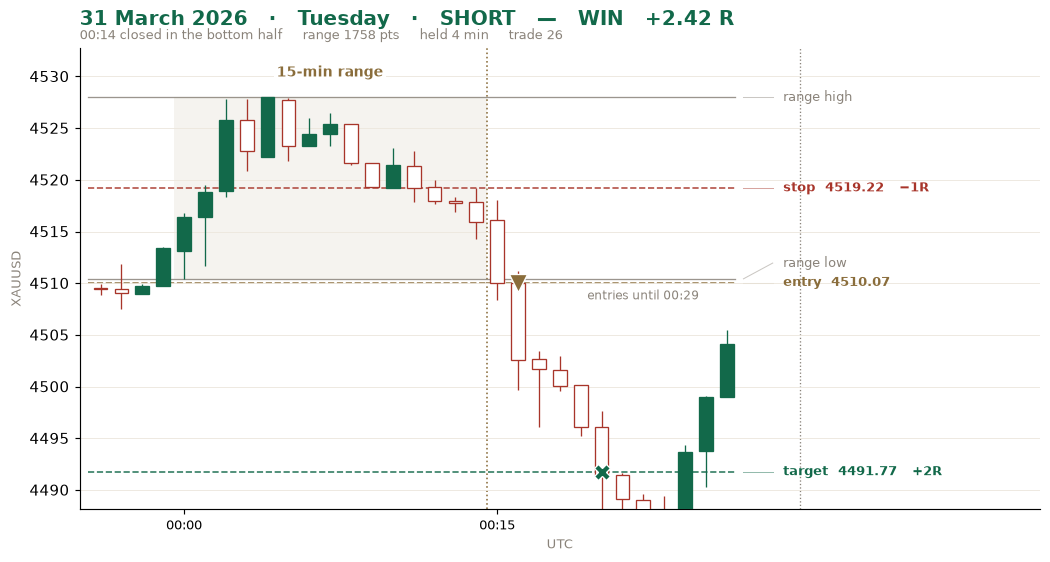 31 Mar Tue · SELL · closed bottom half · +2.42 R
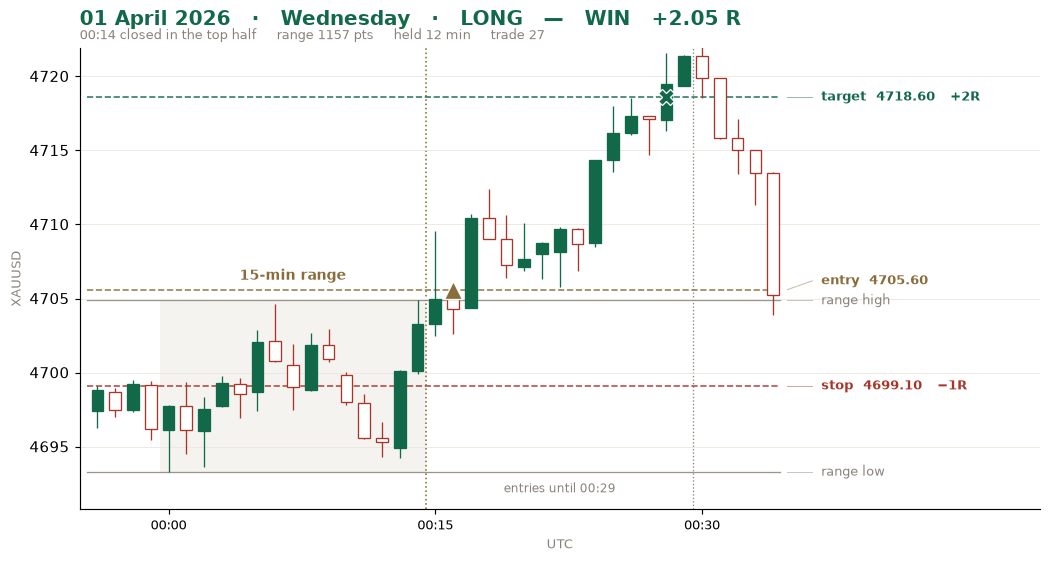 01 Apr Wed · BUY · closed top half · +2.05 R
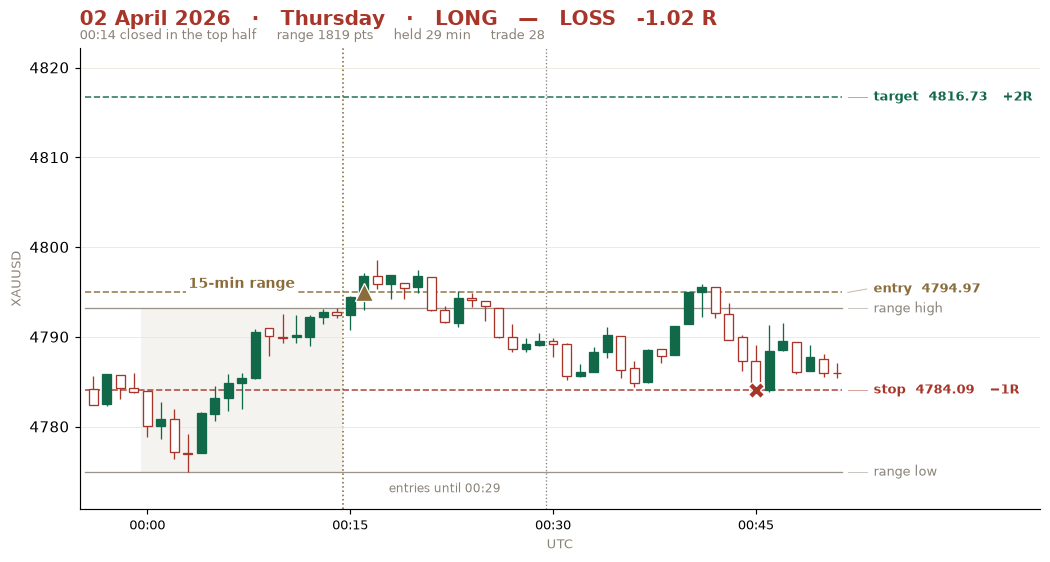 02 Apr Thu · BUY · closed top half · -1.02 R
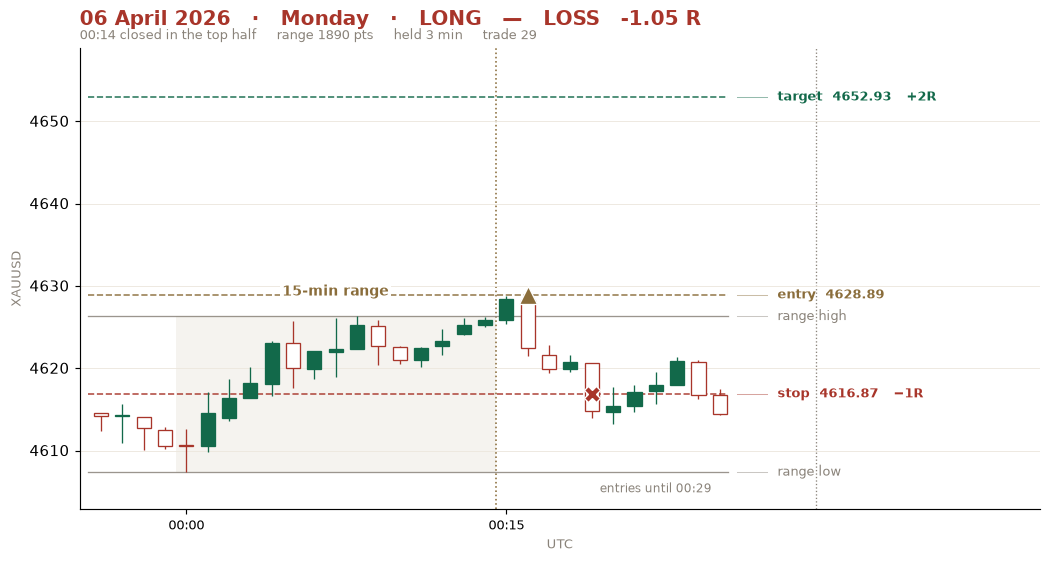 06 Apr Mon · BUY · closed top half · -1.05 R
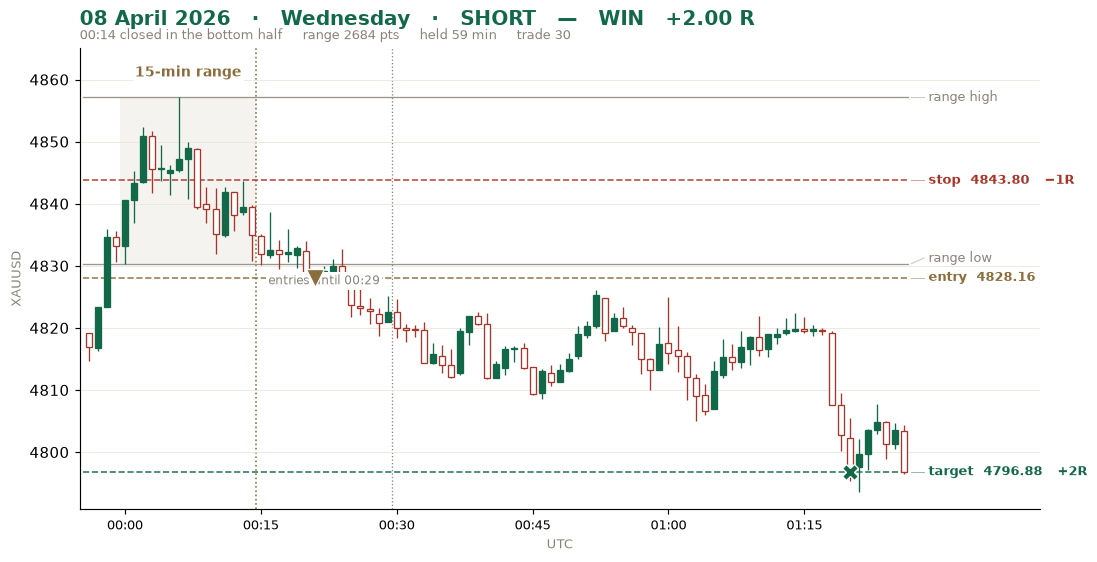 08 Apr Wed · SELL · closed bottom half · +2.00 R
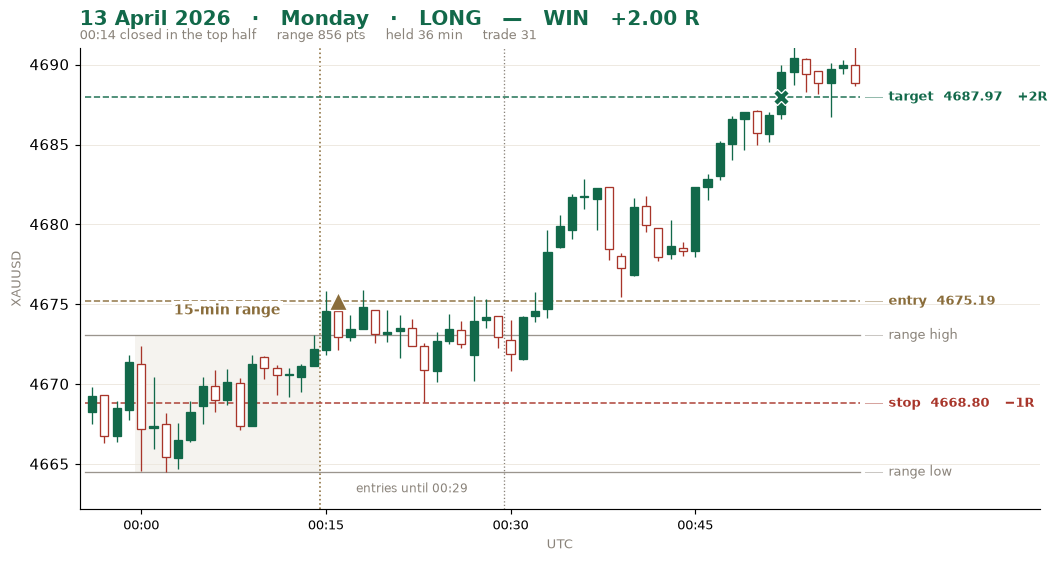 13 Apr Mon · BUY · closed top half · +2.00 R
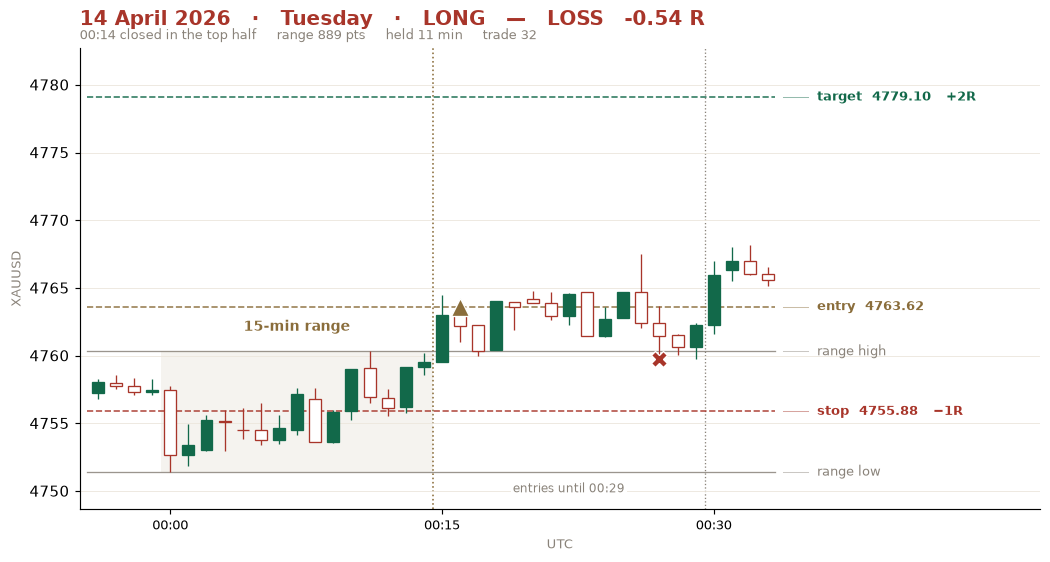 14 Apr Tue · BUY · closed top half · -0.54 R
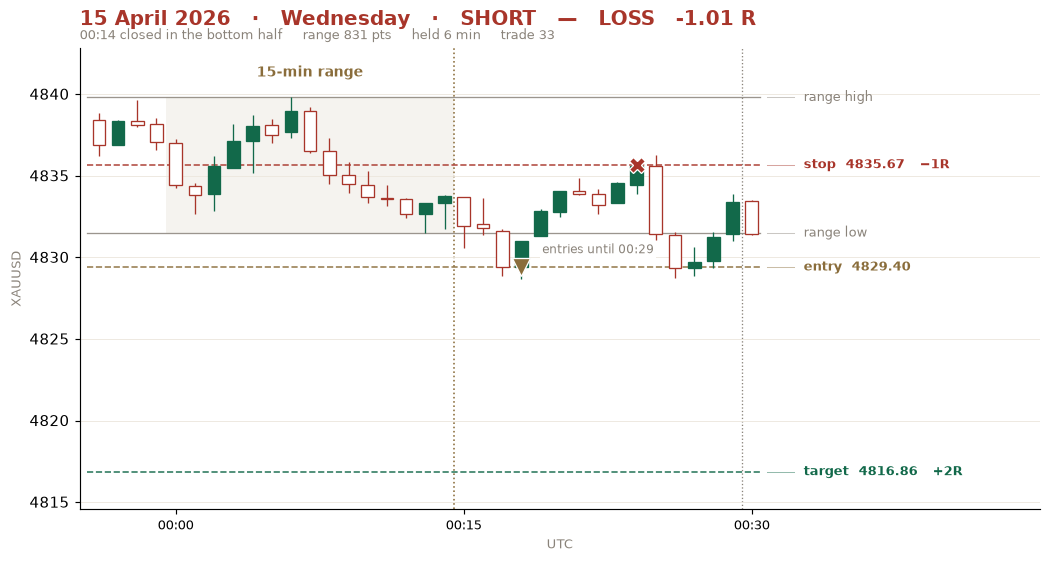 15 Apr Wed · SELL · closed bottom half · -1.01 R
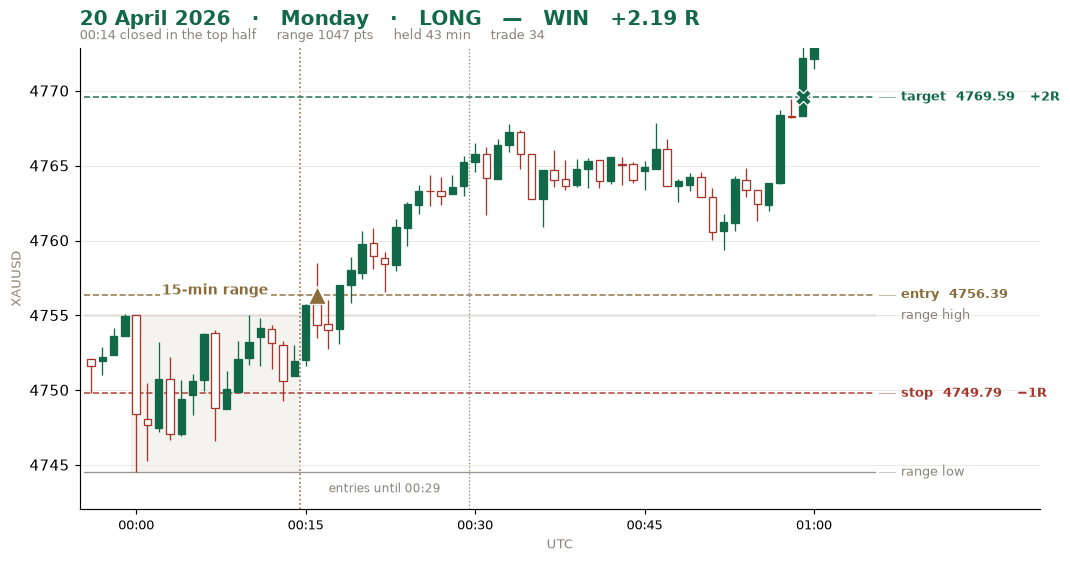 20 Apr Mon · BUY · closed top half · +2.19 R
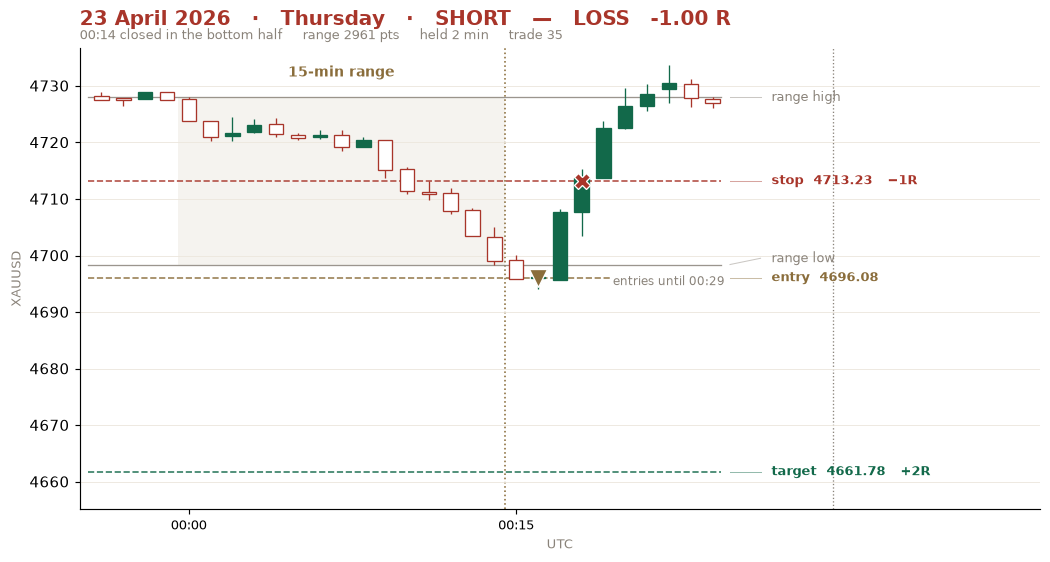 23 Apr Thu · SELL · closed bottom half · -1.00 R
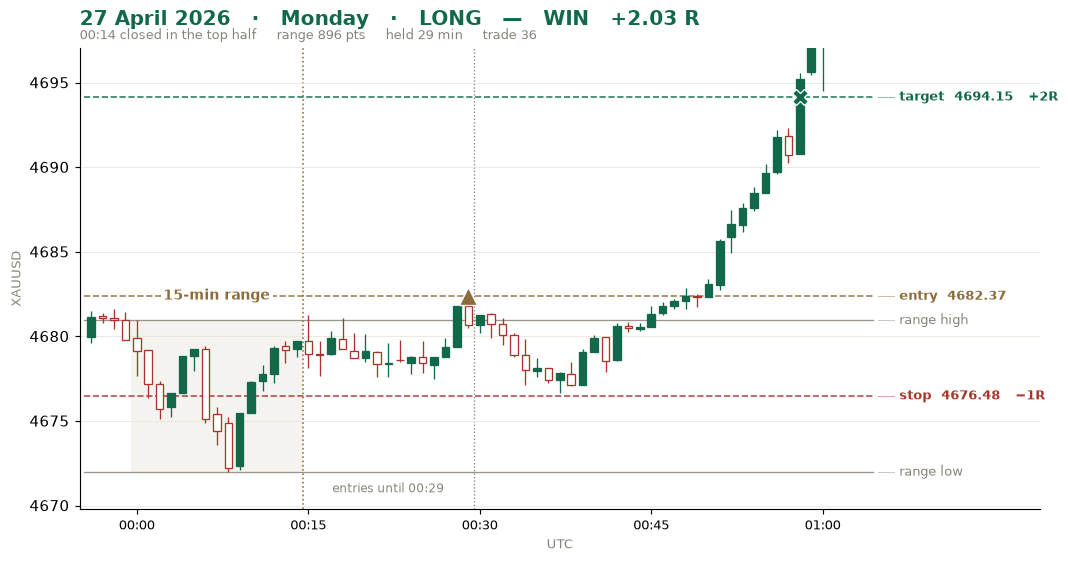 27 Apr Mon · BUY · closed top half · +2.03 R
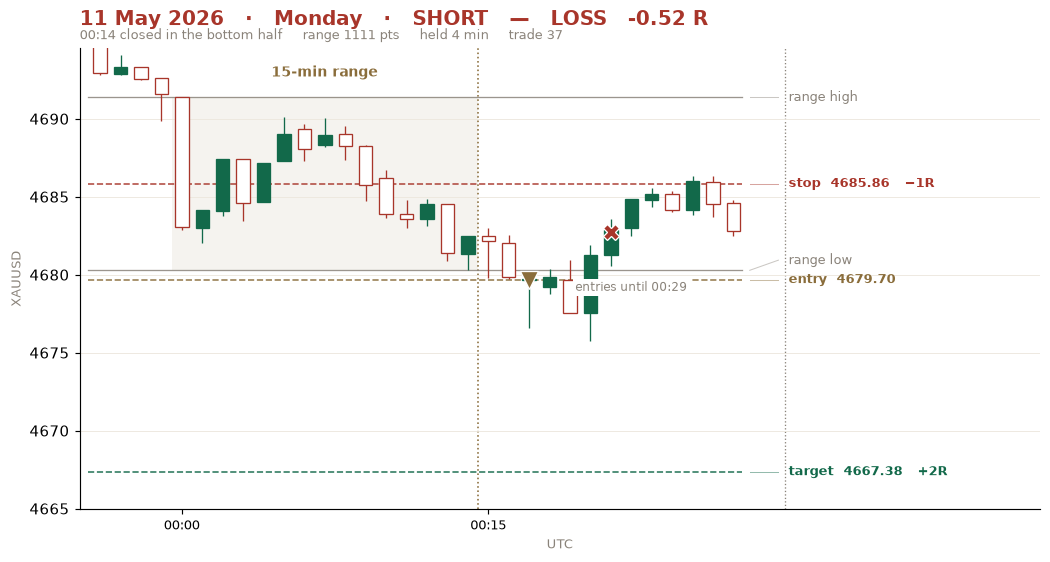 11 May Mon · SELL · closed bottom half · -0.52 R
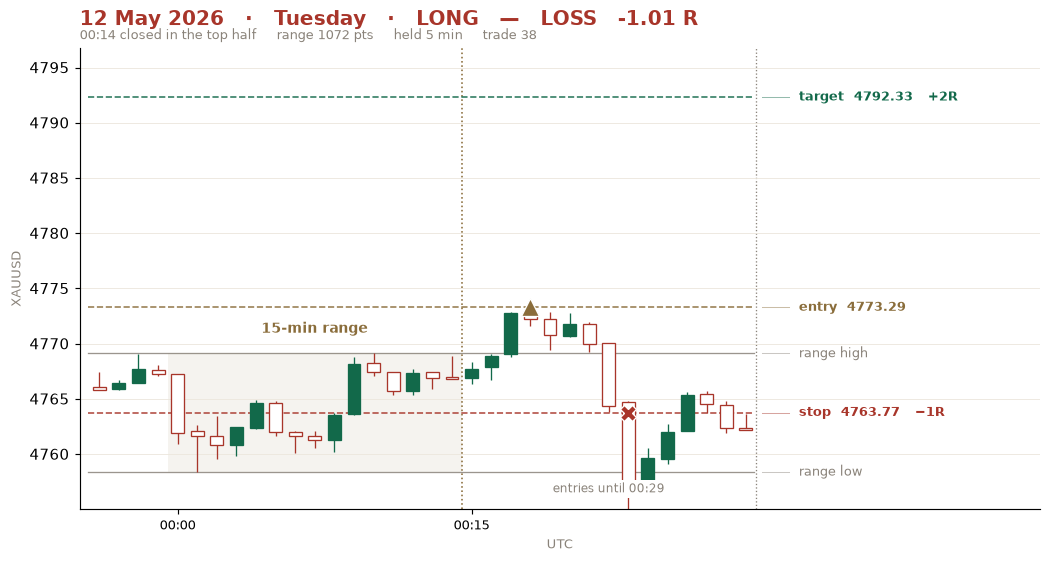 12 May Tue · BUY · closed top half · -1.01 R
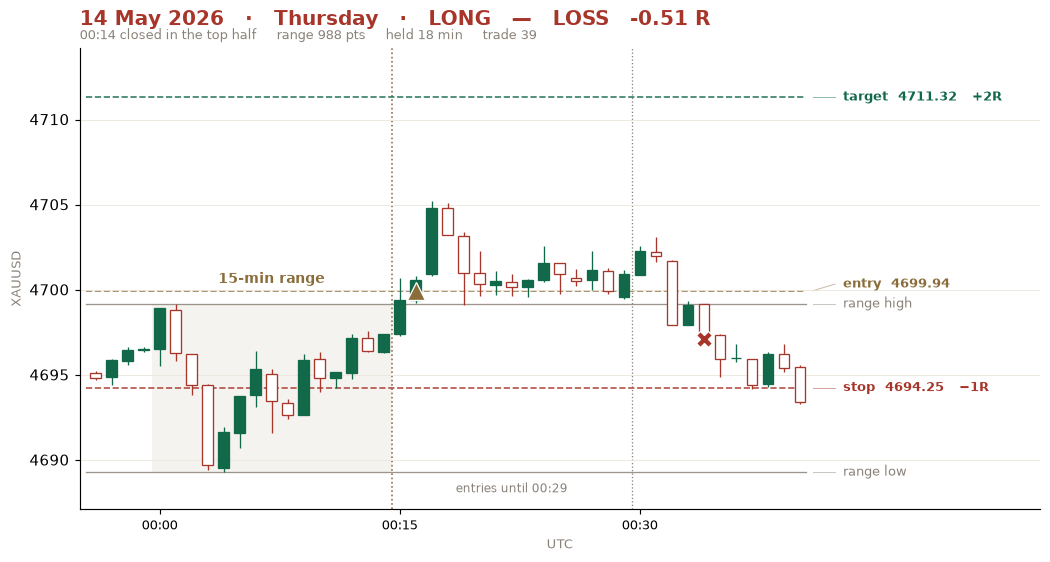 14 May Thu · BUY · closed top half · -0.51 R
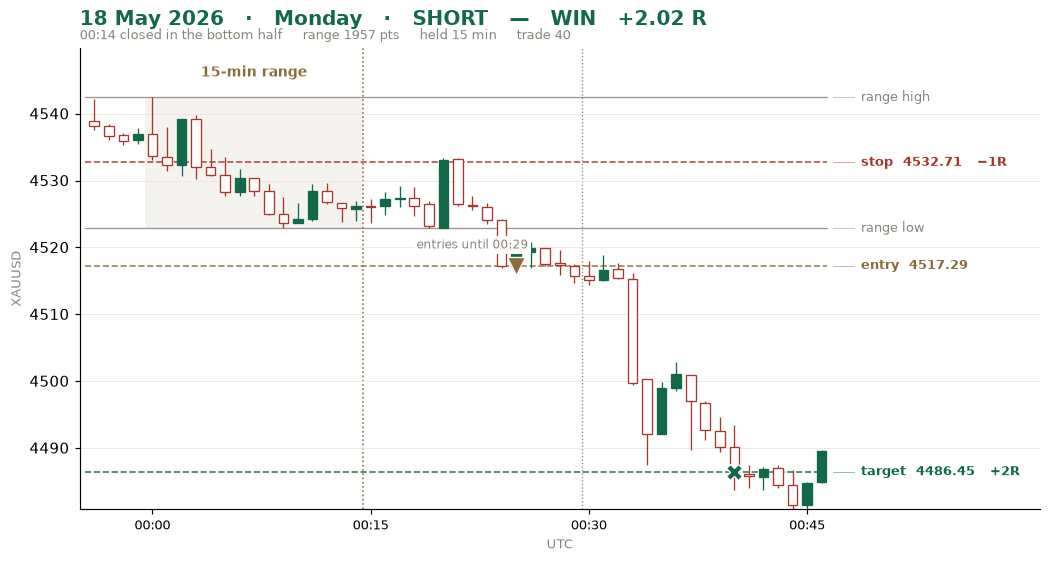 18 May Mon · SELL · closed bottom half · +2.02 R
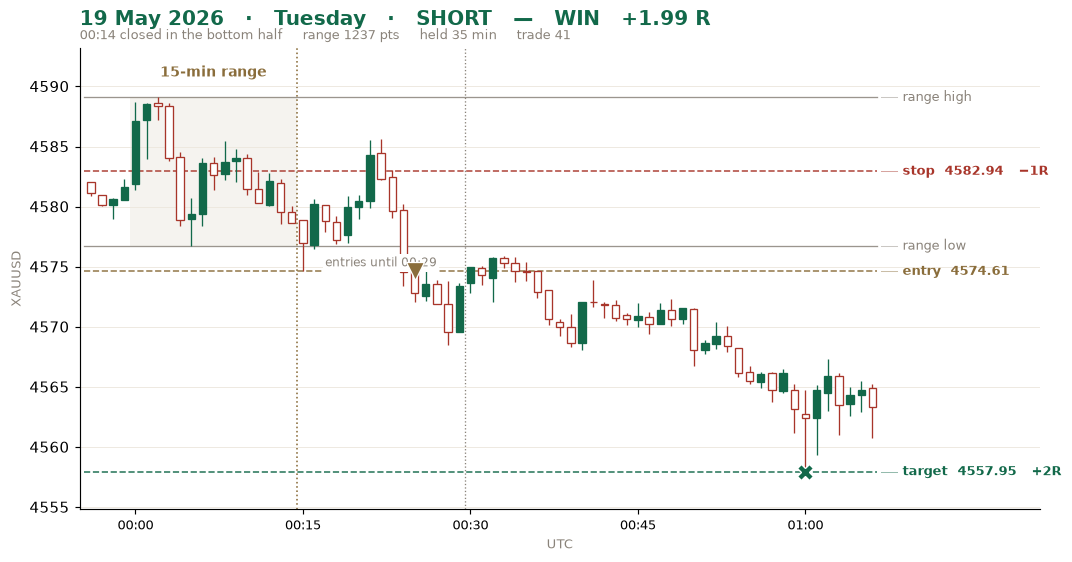 19 May Tue · SELL · closed bottom half · +1.99 R
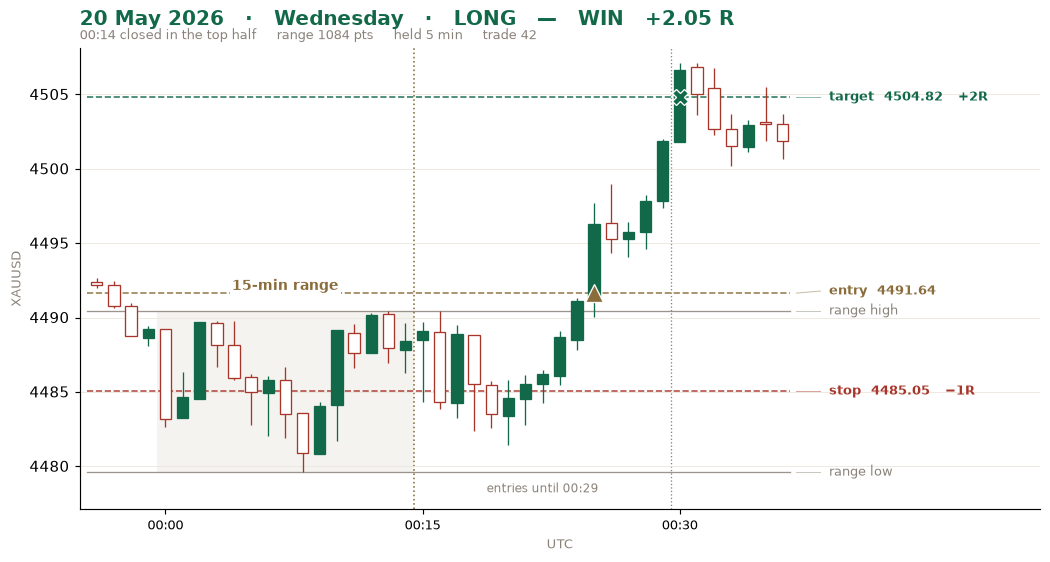 20 May Wed · BUY · closed top half · +2.05 R
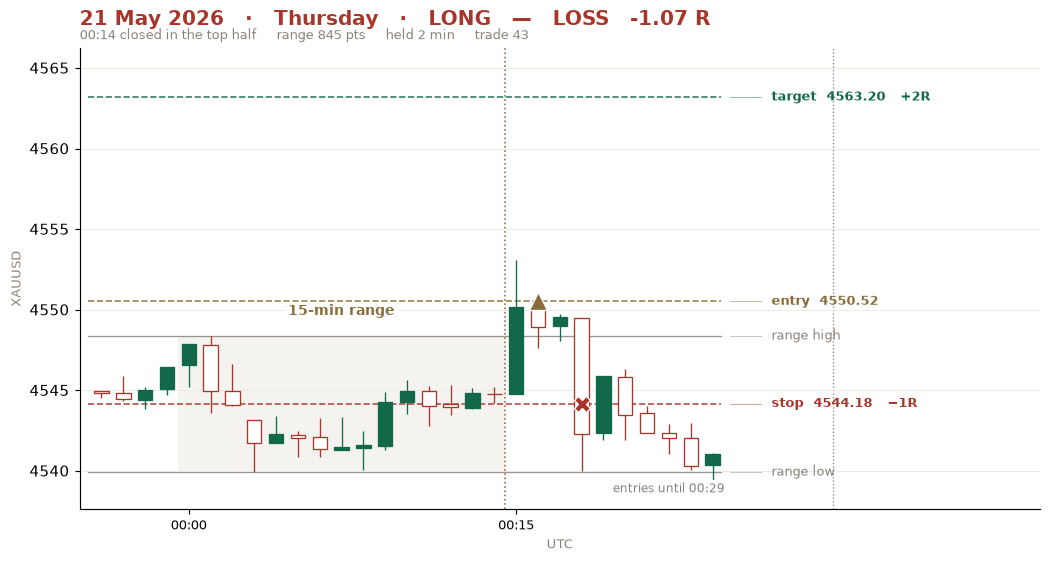 21 May Thu · BUY · closed top half · -1.07 R
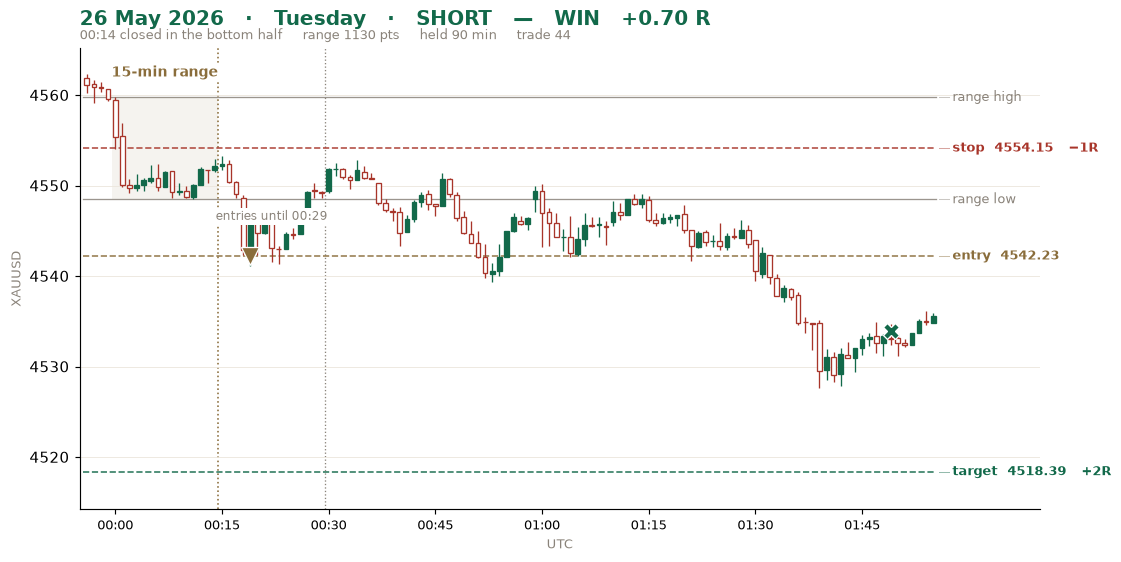 26 May Tue · SELL · closed bottom half · +0.70 R
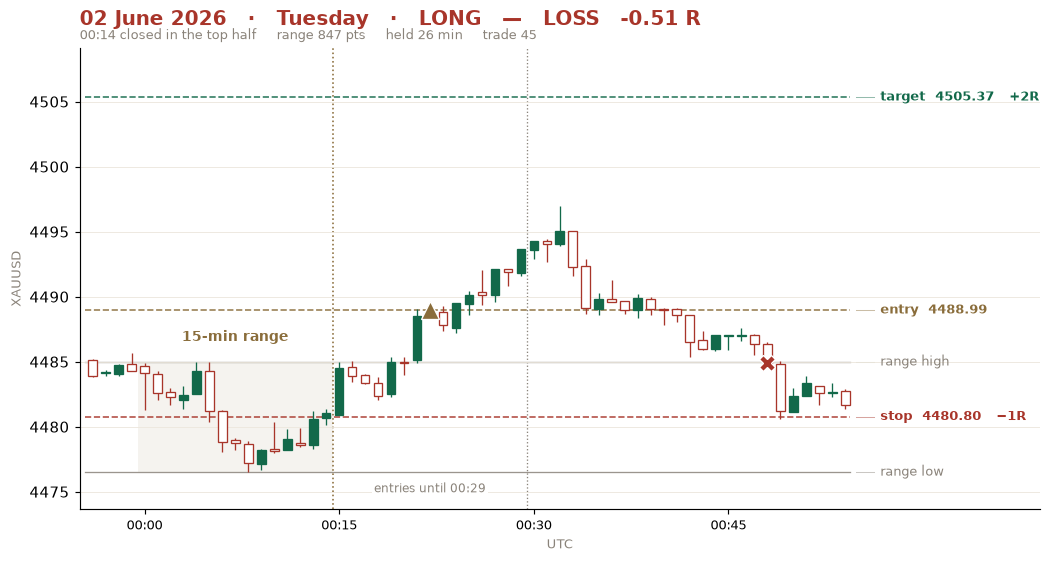 02 Jun Tue · BUY · closed top half · -0.51 R
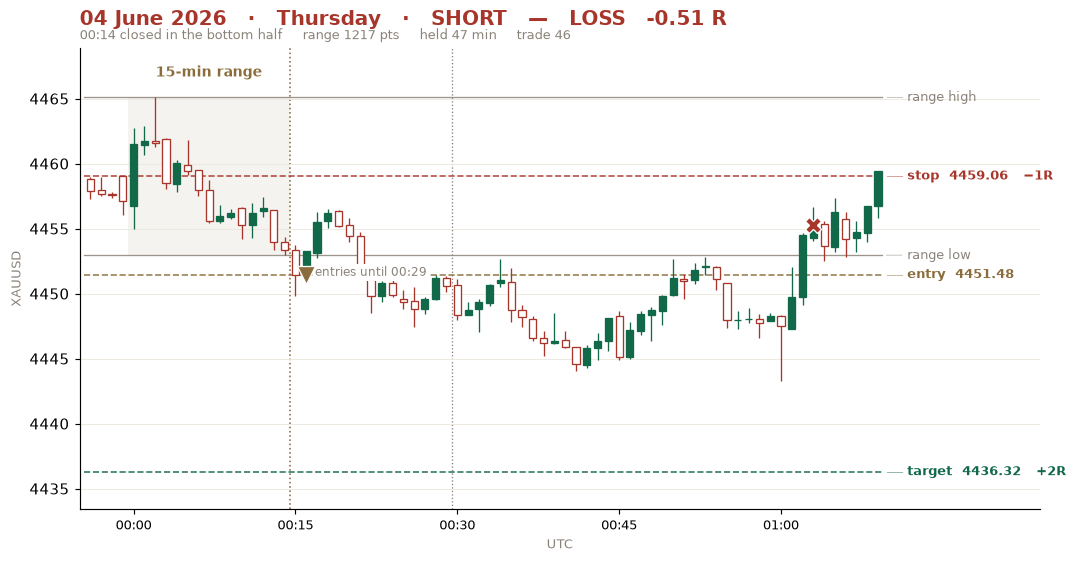 04 Jun Thu · SELL · closed bottom half · -0.51 R
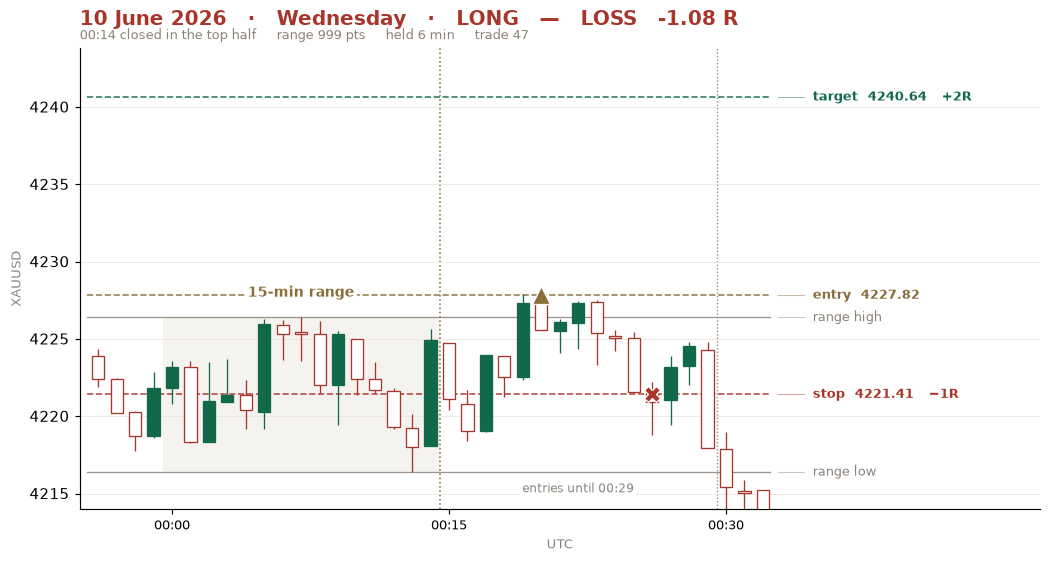 10 Jun Wed · BUY · closed top half · -1.08 R
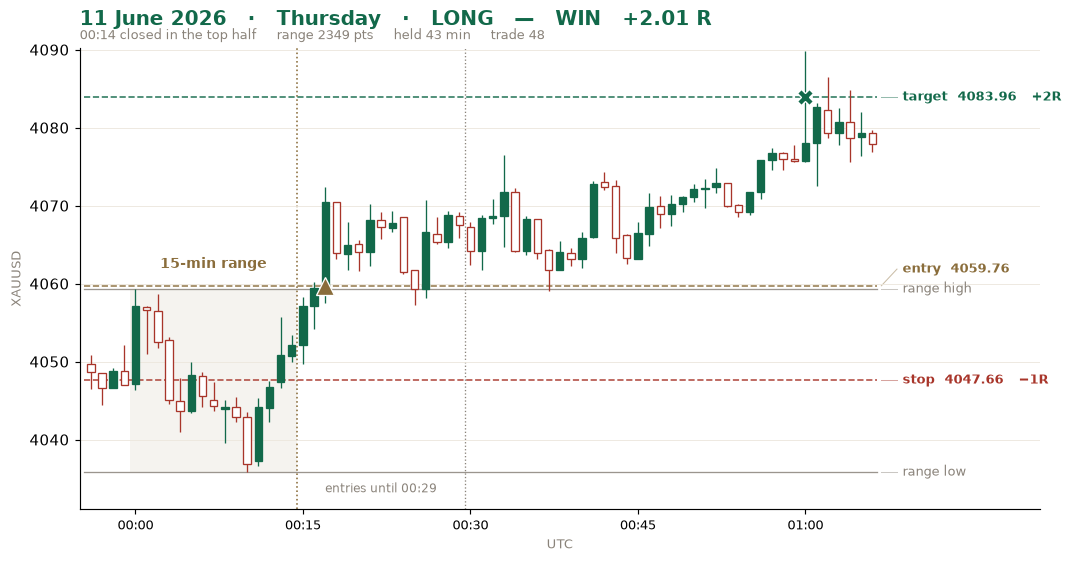 11 Jun Thu · BUY · closed top half · +2.01 R
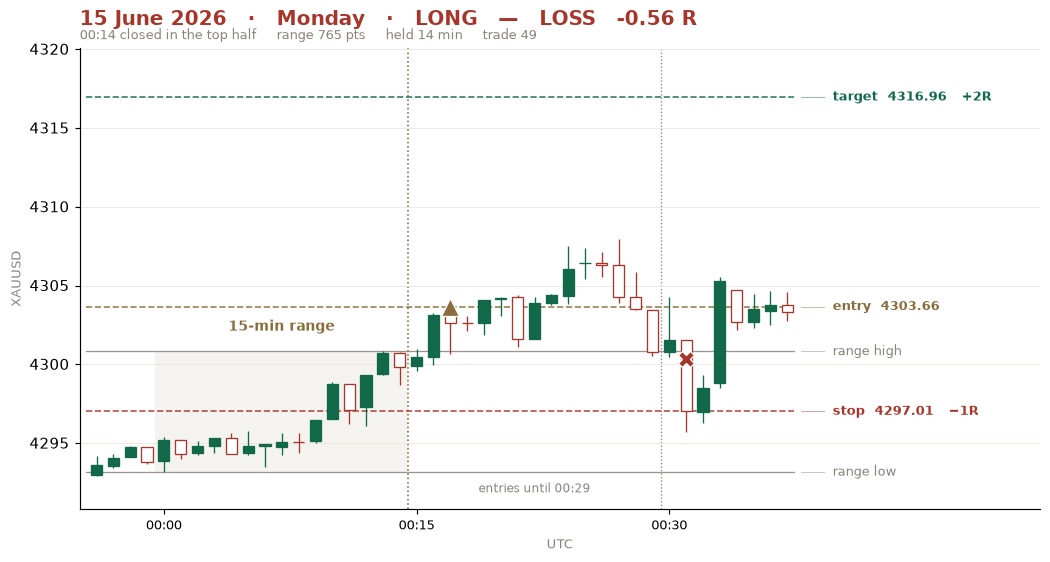 15 Jun Mon · BUY · closed top half · -0.56 R
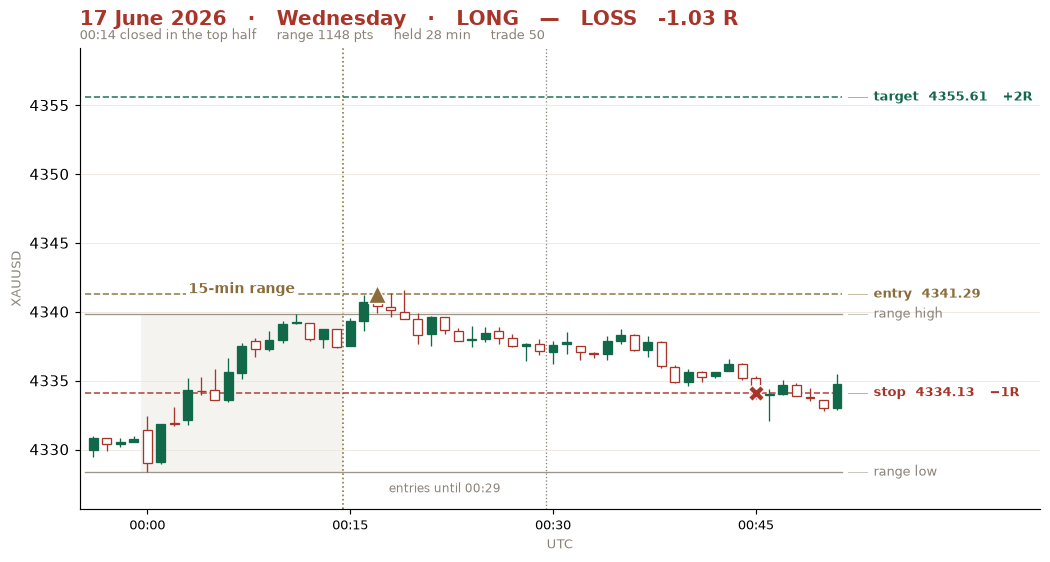 17 Jun Wed · BUY · closed top half · -1.03 R
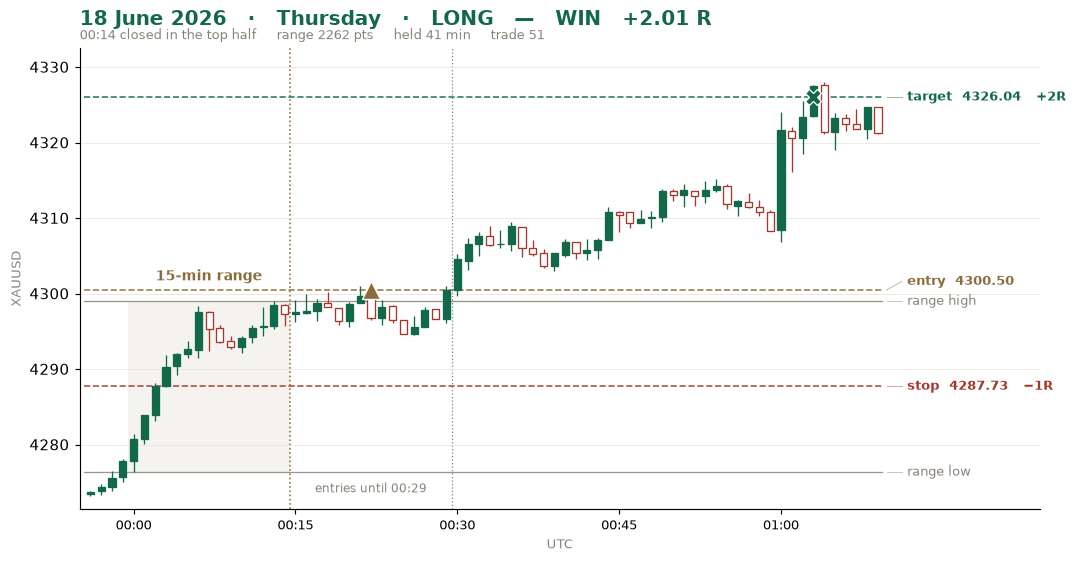 18 Jun Thu · BUY · closed top half · +2.01 R
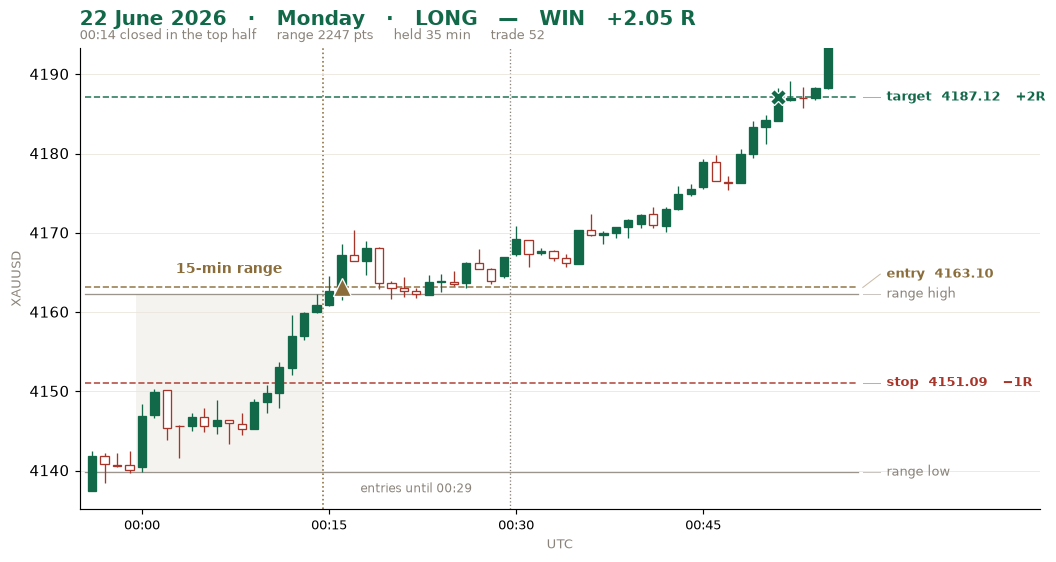 22 Jun Mon · BUY · closed top half · +2.05 R
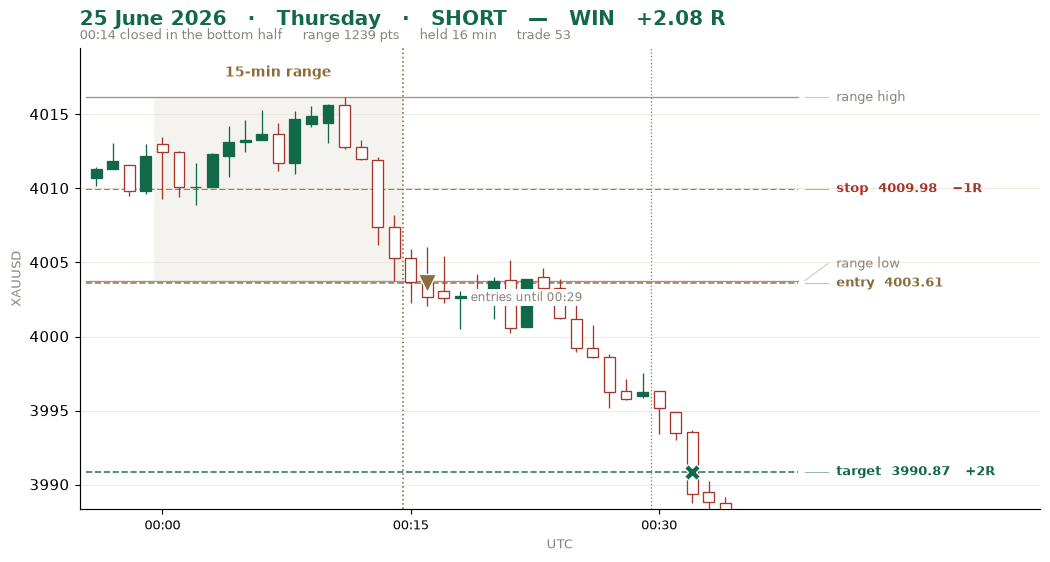 25 Jun Thu · SELL · closed bottom half · +2.08 R
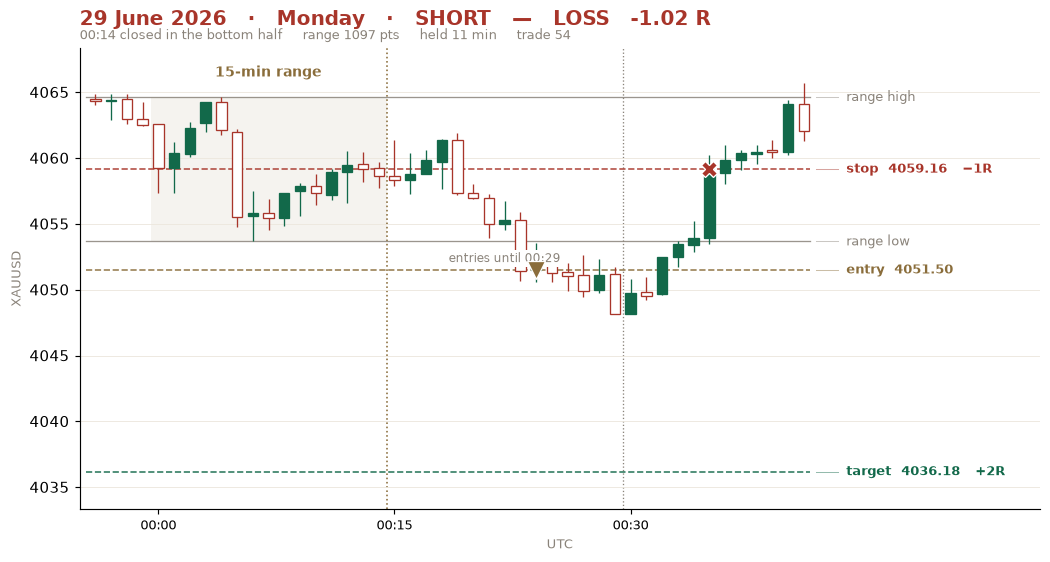 29 Jun Mon · SELL · closed bottom half · -1.02 R
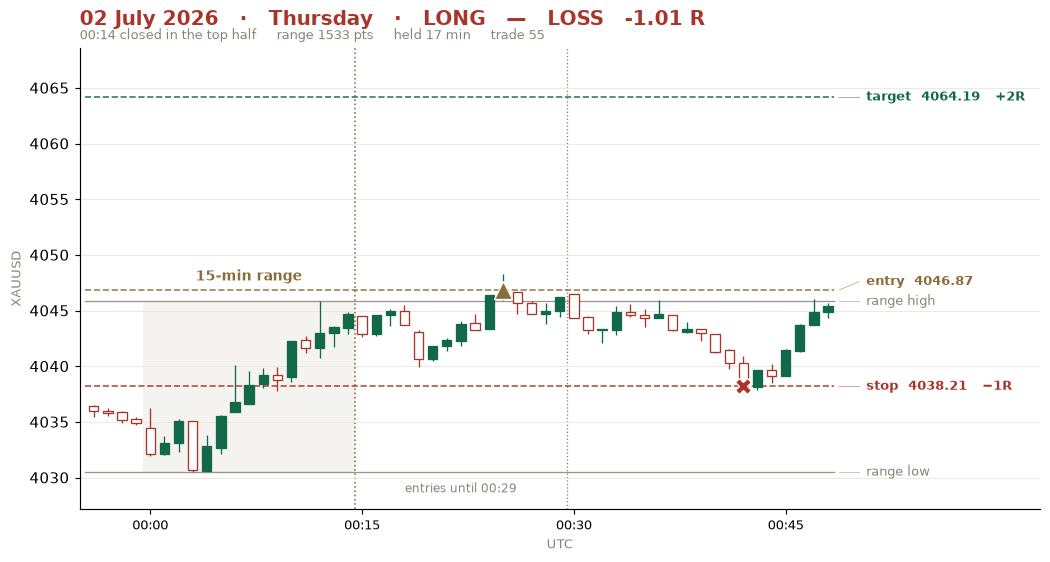 02 Jul Thu · BUY · closed top half · -1.01 R
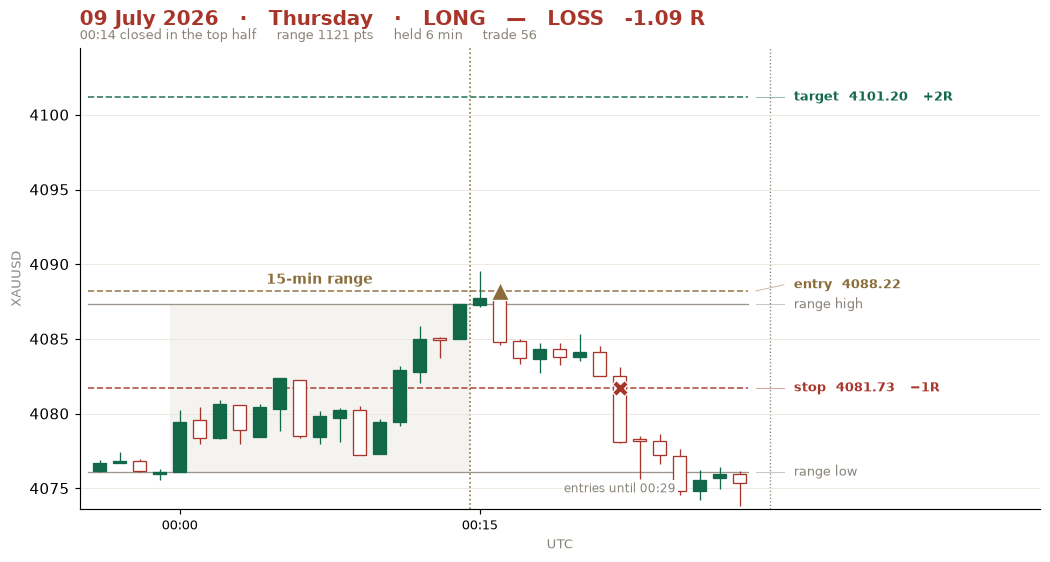 09 Jul Thu · BUY · closed top half · -1.09 R
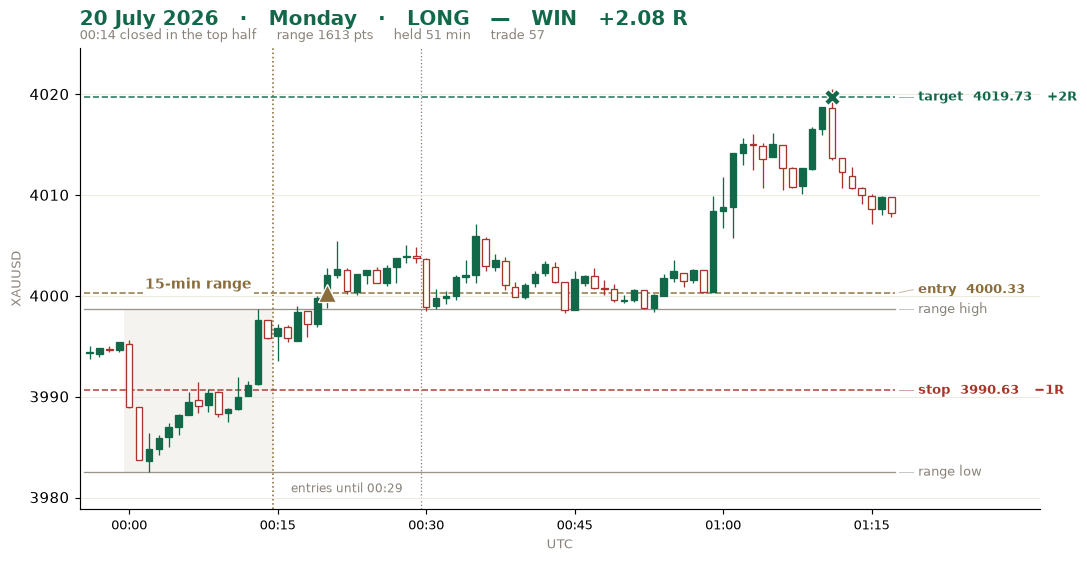 20 Jul Mon · BUY · closed top half · +2.08 R
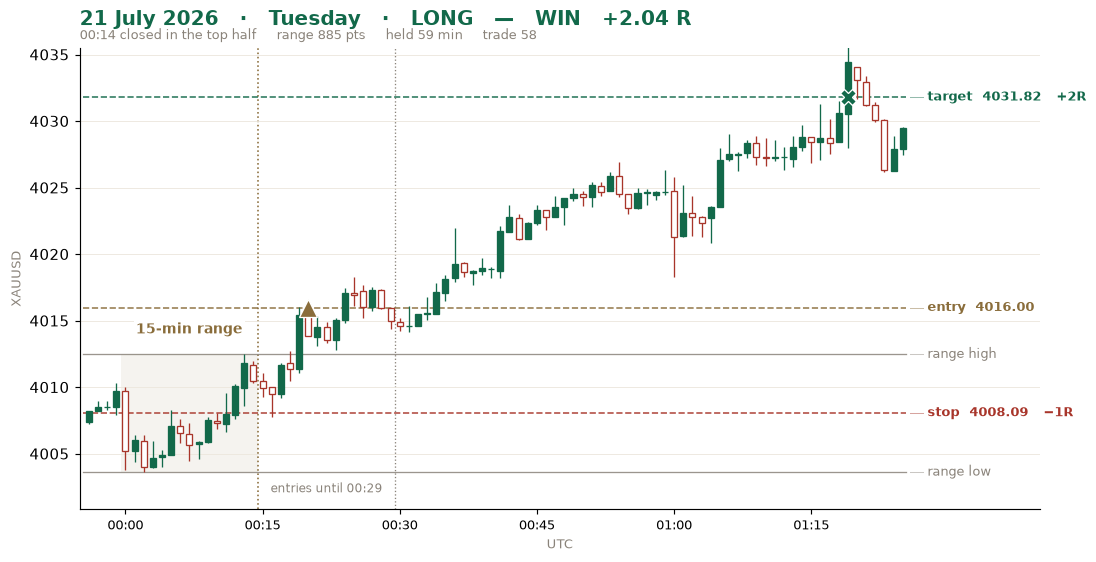 21 Jul Tue · BUY · closed top half · +2.04 R
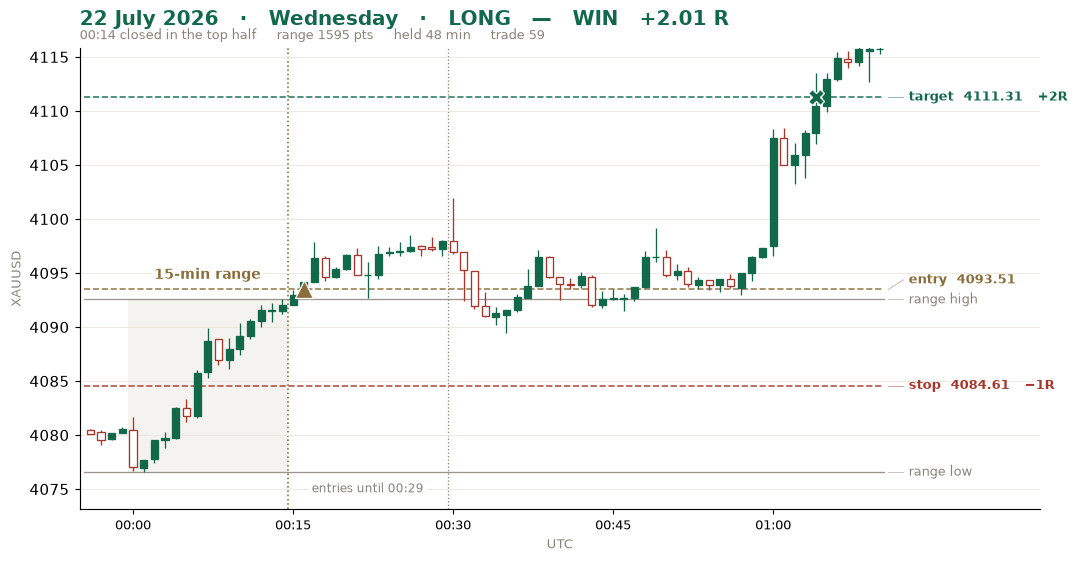 22 Jul Wed · BUY · closed top half · +2.01 R
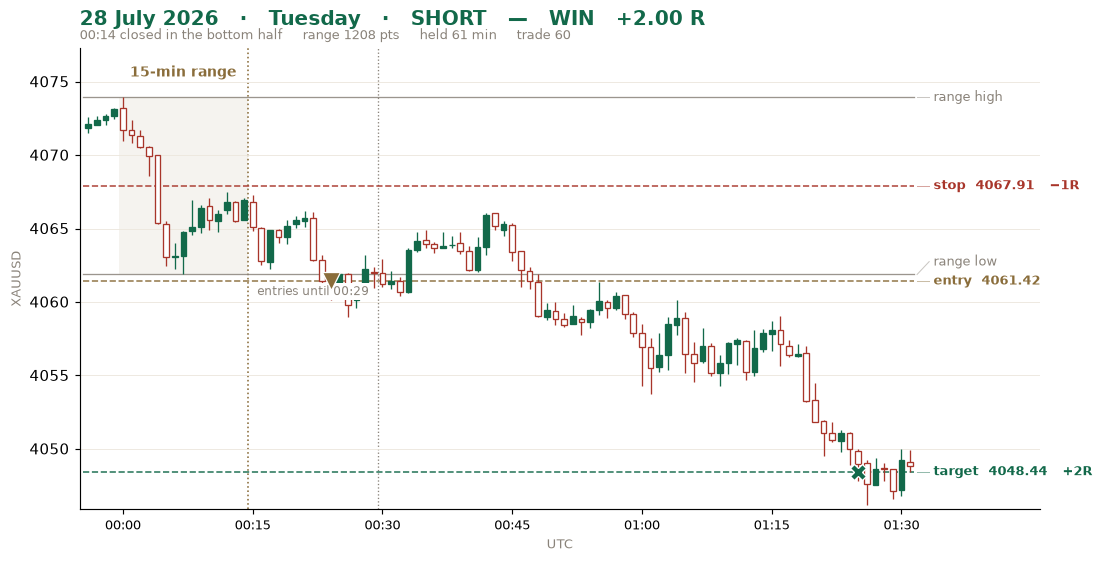 28 Jul Tue · SELL · closed bottom half · +2.00 R
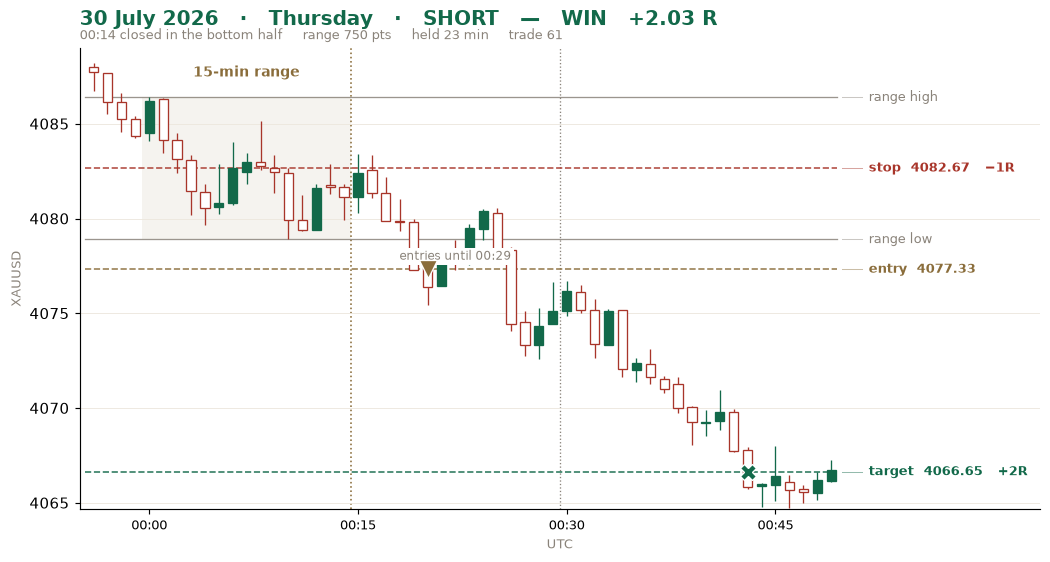 30 Jul Thu · SELL · closed bottom half · +2.03 R
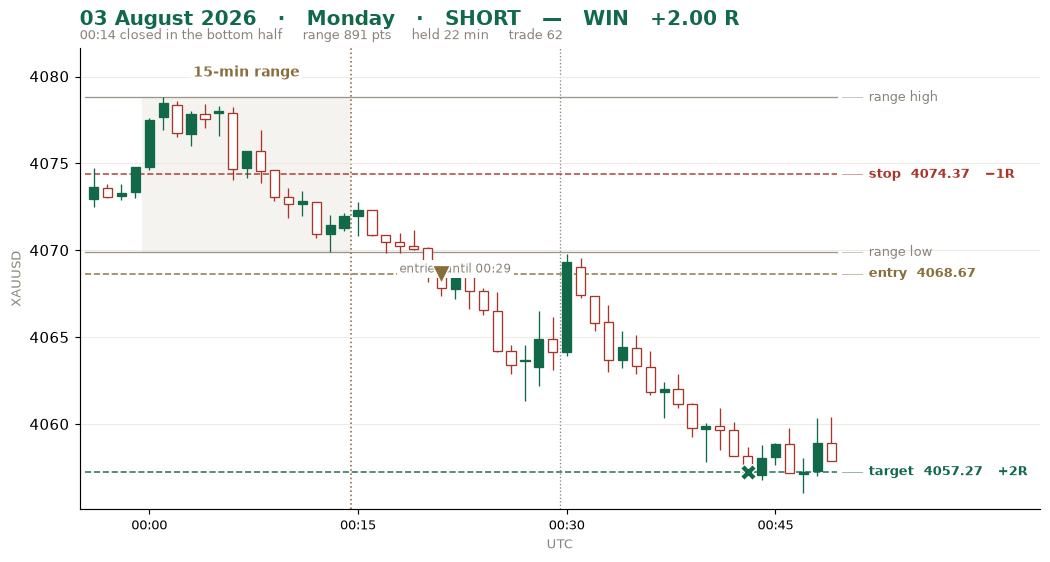 03 Aug Mon · SELL · closed bottom half · +2.00 R
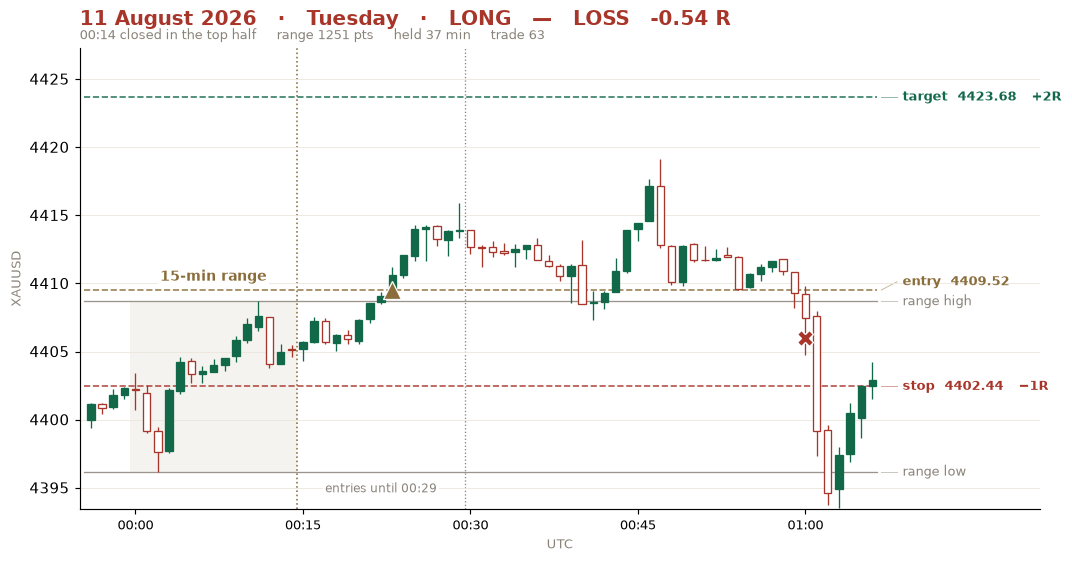 11 Aug Tue · BUY · closed top half · -0.54 R
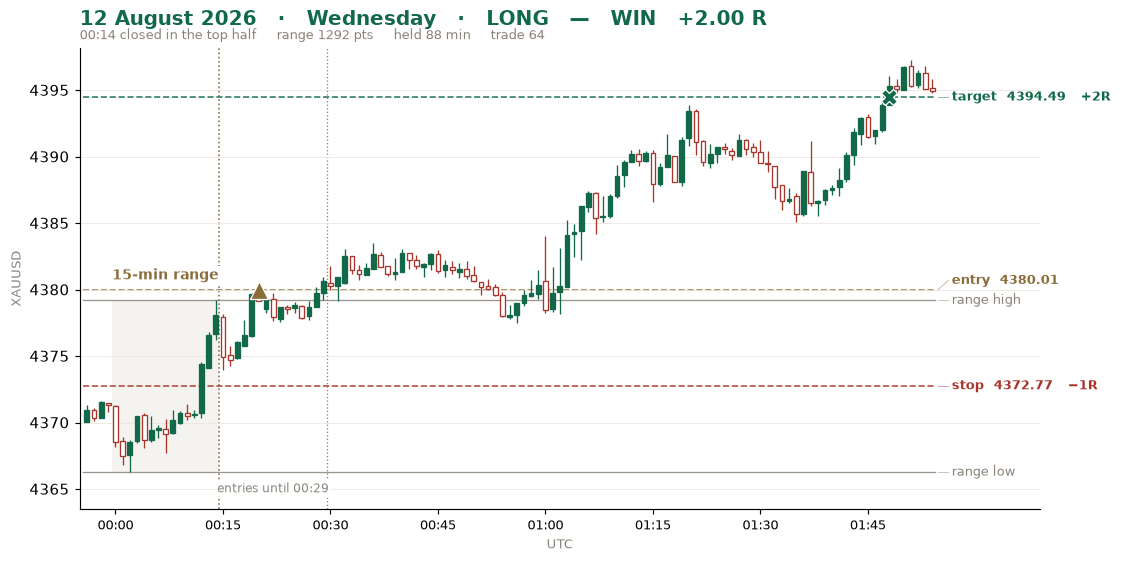 12 Aug Wed · BUY · closed top half · +2.00 R
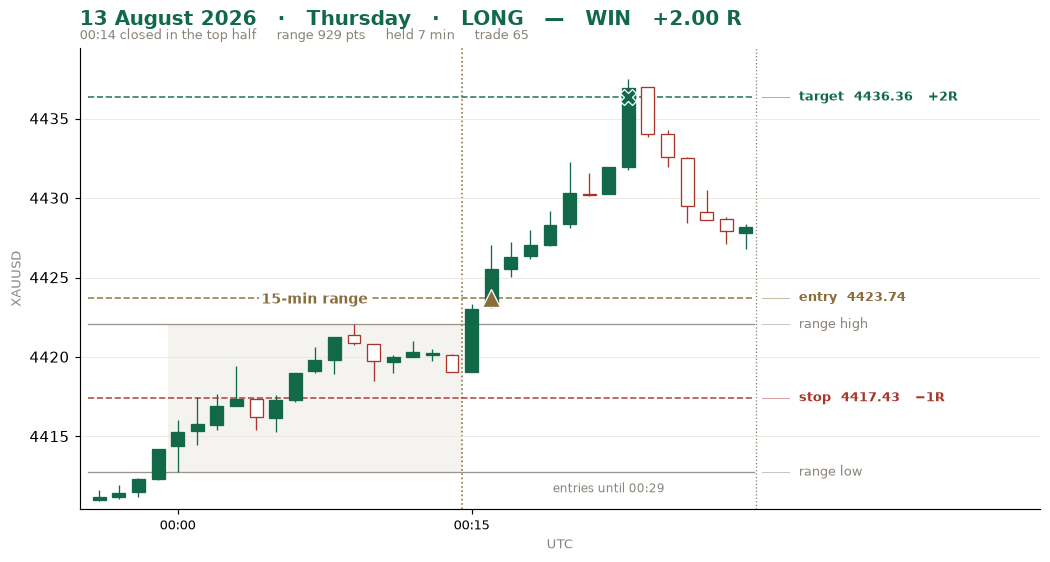 13 Aug Thu · BUY · closed top half · +2.00 R
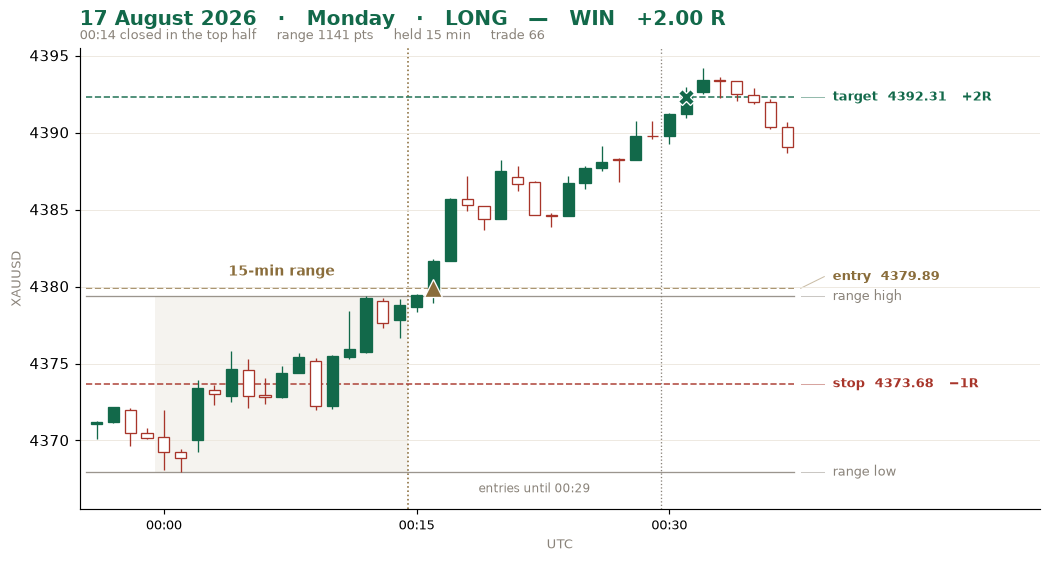 17 Aug Mon · BUY · closed top half · +2.00 R
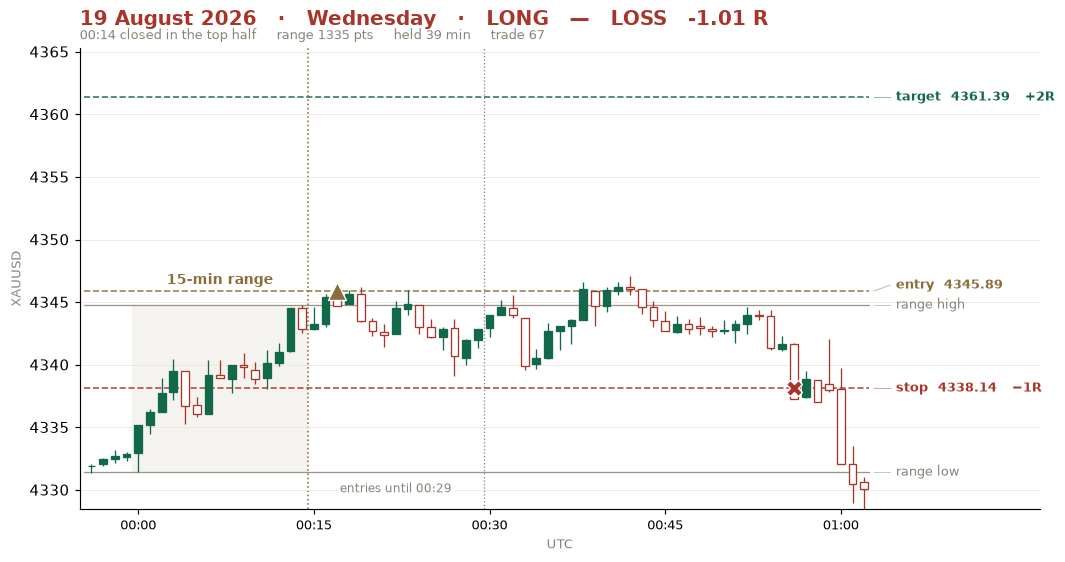 19 Aug Wed · BUY · closed top half · -1.01 R
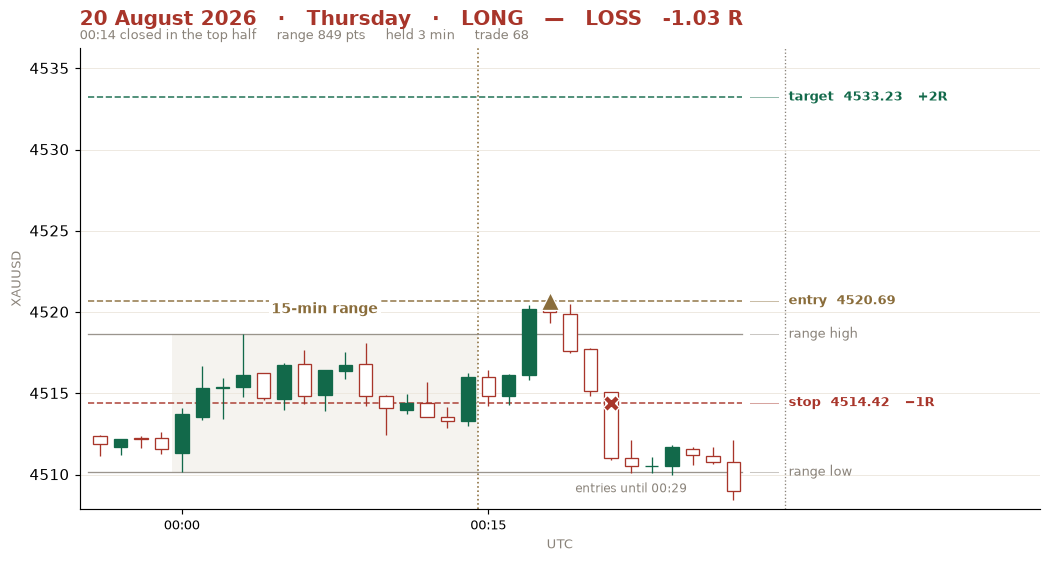 20 Aug Thu · BUY · closed top half · -1.03 R
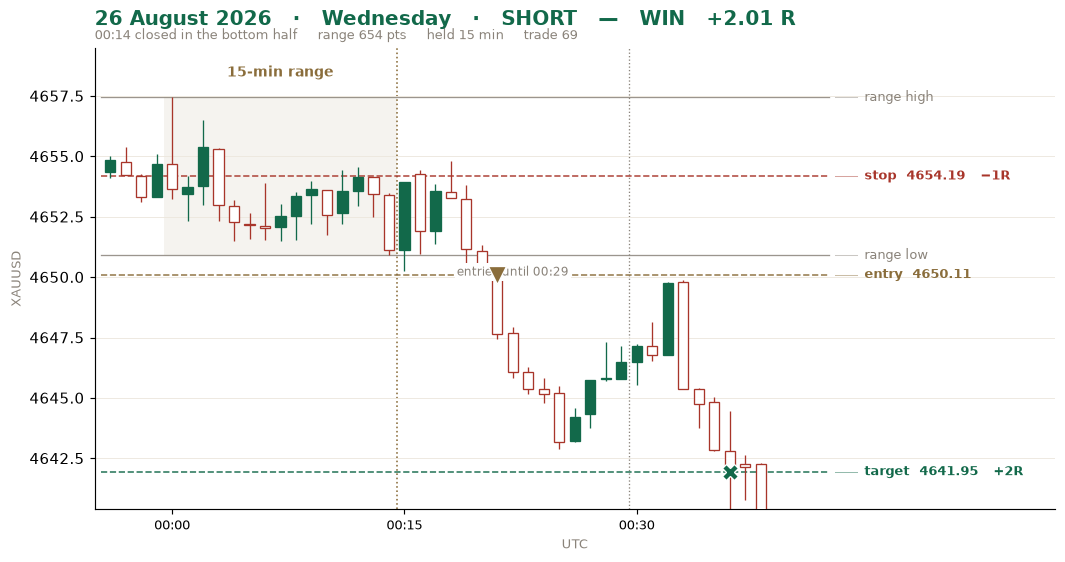 26 Aug Wed · SELL · closed bottom half · +2.01 R
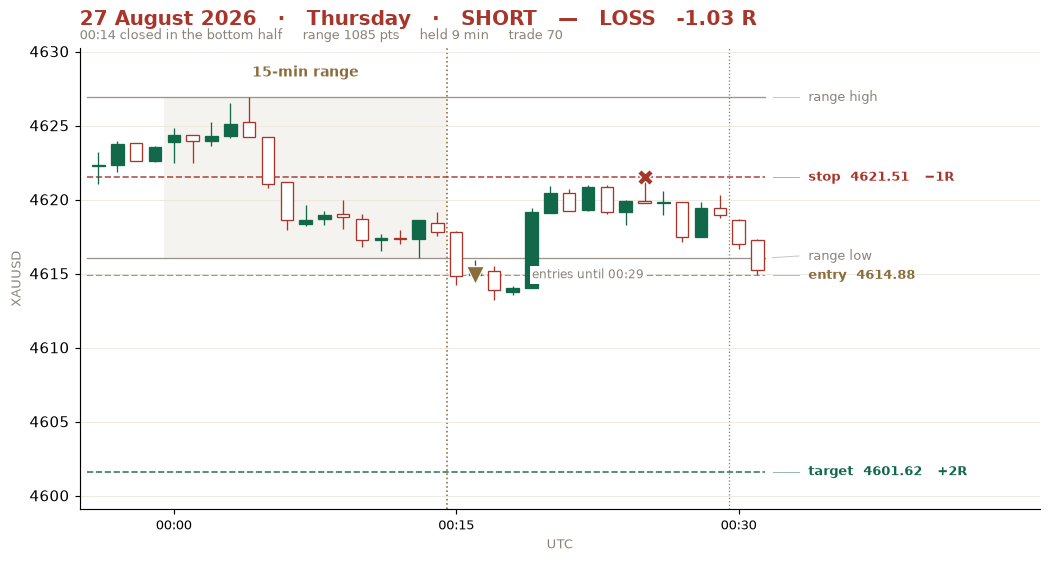 27 Aug Thu · SELL · closed bottom half · -1.03 R
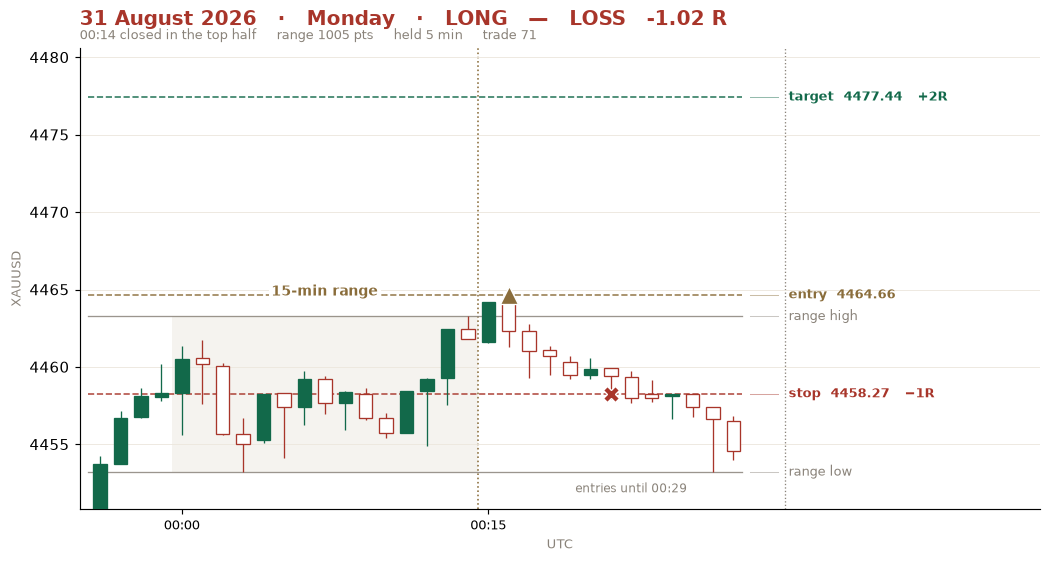 31 Aug Mon · BUY · closed top half · -1.02 R
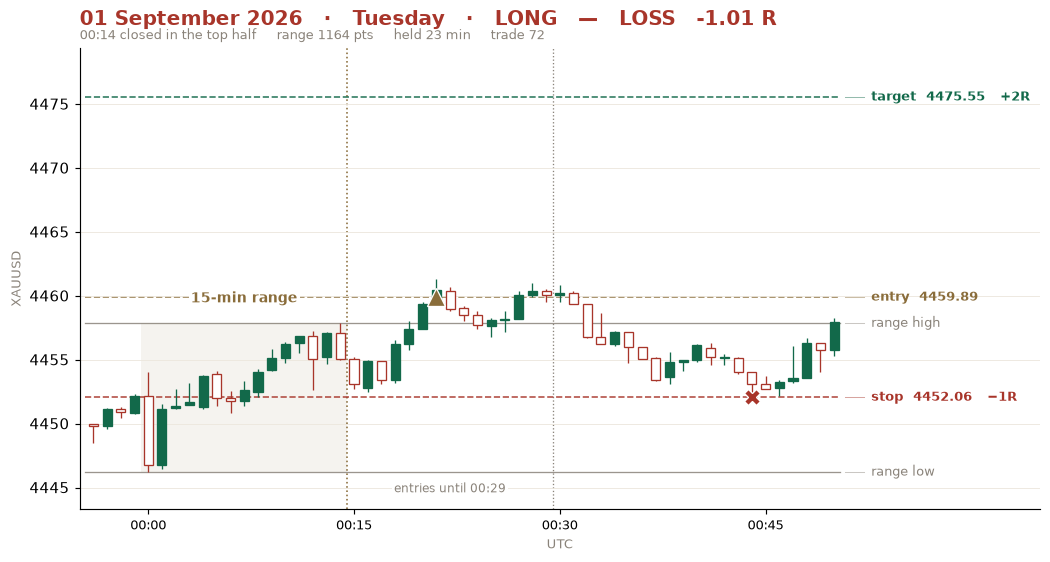 01 Sep Tue · BUY · closed top half · -1.01 R
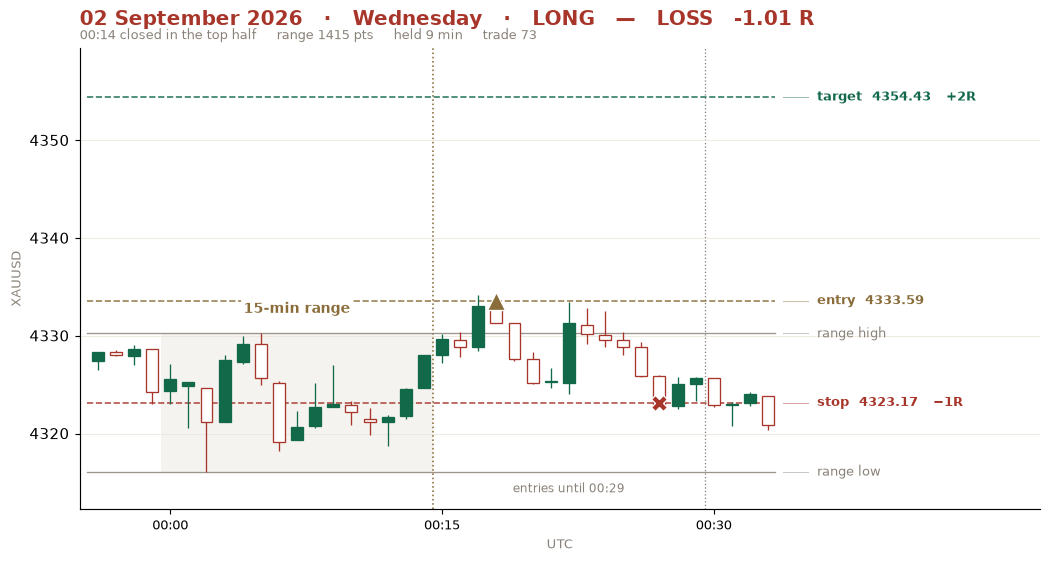 02 Sep Wed · BUY · closed top half · -1.01 R
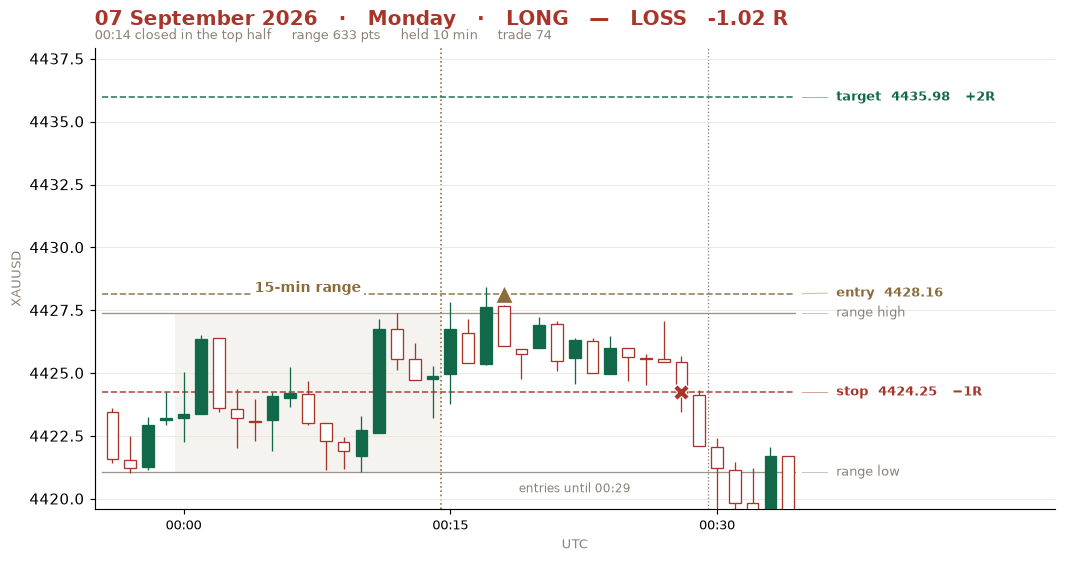 07 Sep Mon · BUY · closed top half · -1.02 R
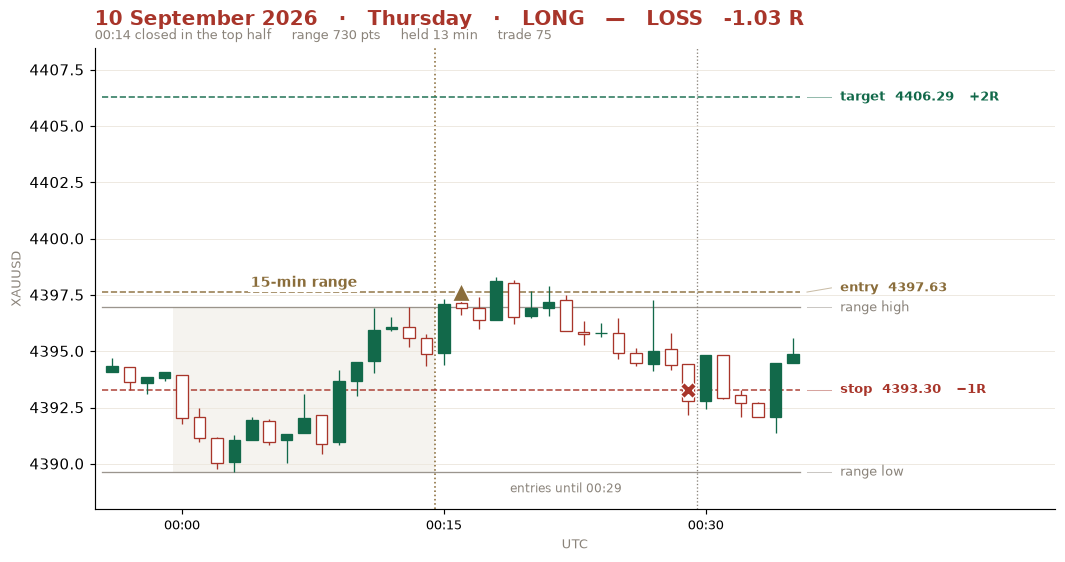 10 Sep Thu · BUY · closed top half · -1.03 R
No trades match those filters.